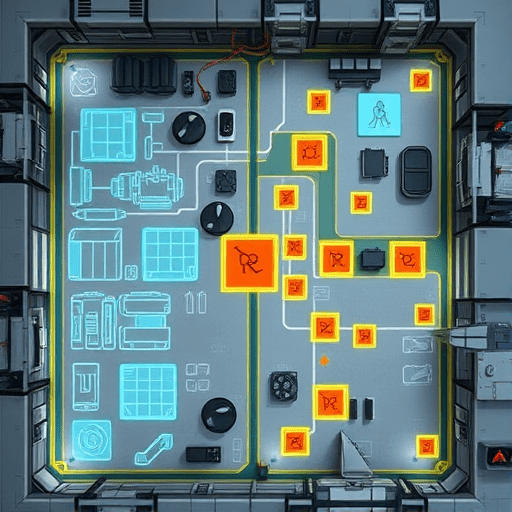
Every factory digital twin begins with promise—a real-time mirror of the physical floor, capable of predicting bottlenecks, testing reconfigurations, and optimizing throughput. But within weeks or even days, that mirror starts to lie. The gap between what the simulation predicts and what actually happens on the line widens, a phenomenon known as simulation drift. To validate digital twin accuracy for factory layouts, operations teams must move beyond static benchmark tests and rethink how and where sensors feed data into the model. The comparison of sensor placement strategies is no longer a technical detail; it is the core of keeping a digital twin honest.
Why Simulation Drift Occurs in Factory Digital Twins
Simulation drift is not caused by a single faulty sensor or a bad algorithm. It emerges from a cascade of small discrepancies: a buffer station that fills faster than modeled, a robot arm whose cycle time drifts with temperature, or a conveyor belt whose speed varies slightly under load. The digital twin accumulates these deviations because the validation loop is either too infrequent or too coarse. The real question is not whether you validate, but where you place the sensors that enable validation—because every sensor is a checkpoint that forces the model to align with physical reality.
In 2026, the challenge is compounded by the rise of modular and reconfigurable factories. Layouts change more often, so the digital twin must be revalidated repeatedly. Sensor placement strategies that worked for a static line will fail in a dynamic environment. This is why the choice of sensor density, location, and data fusion strategy directly determines how much drift you can tolerate before the model becomes unreliable.
Comparing Sensor Placement Strategies: Dense Grid vs. Targeted Zones
There are two dominant approaches to placing sensors for digital twin validation in factory layouts. Each has trade-offs that affect accuracy, cost, and drift reduction.
Dense Grid Strategy
The dense grid approach distributes sensors evenly across the entire factory floor—on every conveyor segment, at every workstation, and along every buffer lane. The advantage is obvious: you capture almost every state change, and the digital twin can be corrected at a fine granularity. Simulation drift is caught early because a deviation at any single point can be immediately compared against the model’s prediction.
However, dense grids are expensive to install and maintain. They generate massive amounts of data that can overwhelm the twin’s ingestion pipeline. More importantly, they create an illusion of accuracy: because you are measuring everywhere, you may assume the model is correct everywhere. But the sheer volume of data can mask systematic errors—for example, if all sensors are miscalibrated in the same way, the twin will confidently drift in unison.
Targeted Zones Strategy
The targeted zones strategy places sensors only at high-impact decision points: machine outputs, merge points, transfer stations, and quality gates. The logic is that these are the locations where small deviations have outsized consequences. By focusing validation there, you can catch drift that would alter production outcomes, while ignoring low-impact variability that does not affect the validity of the simulation.
This approach is more cost-effective and produces cleaner data streams. But it has a blind spot: drift that originates in unmonitored zones can silently propagate to the targeted zones, and by the time you detect it, the error is already large. The targeted strategy works well only if you regularly reassess which zones matter, especially as the factory layout changes.
Hybrid Approaches and the Role of Virtual Sensors
The most effective strategy for validating digital twin accuracy in factory layouts is not a pure grid or pure targeted approach—it is a hybrid that adapts over time. In practice, this means maintaining a baseline of fixed, targeted sensors at critical decision points, and then deploying temporary or movable sensors in areas where the model’s confidence is low or where layout changes have introduced uncertainty.
Virtual sensors amplify this hybrid approach. Instead of requiring a physical device, a virtual sensor uses data from adjacent physical sensors, machine controls, and historical patterns to infer the state of an unmeasured location. For example, if the digital twin knows the exact speed of a motor and the torque being applied, it can estimate the position of a robot arm without a dedicated encoder. Virtual sensors allow you to expand your validation coverage without adding hardware, and they are particularly useful in 2026 factories where flexible tooling and autonomous carts mean the physical layout is never static.
Accuracy Metrics That Matter for Factory Layout Validation
Comparing sensor placement strategies is meaningless without a clear definition of accuracy. Traditional metrics like mean absolute error (MAE) or root mean squared error (RMSE) are useful, but they do not capture the spatial and temporal dimensions of simulation drift. For factory layouts, you need metrics that map directly to operational decisions.
- Positional drift error: The difference in meters or centimeters between where the twin predicts a WIP (work-in-progress) item should be and where it actually is at a given timestamp.
- Throughput deviation: The percentage difference between simulated and actual parts-per-hour at each workstation. This is the most common metric that production managers care about.
- Sojourn time error: The error in time that a part spends in a buffer or queue. High sojourn time errors indicate that the twin’s model of congestion is inaccurate.
- State transition accuracy: How often the twin correctly predicts the next state of a machine (running, idle, faulted, blocked). This is a binary metric but highly correlated with drift.
- Spatial-temporal drift gradient: A newer metric that measures how drift accumulates across space and over time. This helps you identify whether drift is a local phenomenon or a systemic modelling issue.
By tracking these metrics in relation to your sensor placement, you can directly compare the dense grid and targeted zones strategies. For example, a dense grid will likely score better on positional drift error, but a targeted strategy may deliver the same throughput deviation accuracy at a fraction of the cost.
A 2026 Framework for Periodic Revalidation
Sensor placement alone will not eliminate simulation drift—you need a validation cadence that matches the rate at which your factory changes. The following framework, designed for modern, reconfigurable factories, is adaptable to both sensor strategies.
- Baseline mapping: After any significant change to the layout, run a full-coverage validation using temporary mobile sensors or a drone-mounted lidar system. This captures the new physical reality and recalibrates the twin’s geometry.
- Continuous targeted validation: Use your fixed targeted sensors to constantly compare key performance indicators. Define alarm thresholds for each metric so that drift is flagged before it affects production.
- Weekly virtual sensor audit: Recalculate the outputs of virtual sensors against recent physical measurements. If a virtual sensor consistently deviates, it is a signal that the underlying model assumptions are stale.
- Monthly drift hotspot analysis: Aggregate all sensor data and compute the spatial-temporal drift gradient. This tells you whether you need to adjust your sensor placement strategy rather than simply recalibrating the model.
- Quarterly strategy comparison: Spend one day with no production, move some sensors to a test configuration, and compare the accuracy metrics against the standard placement. This empirical test prevents your sensor strategy from becoming static.
Case Example: Automotive Assembly Line
Consider a factory that assembles electric vehicle battery packs. The line includes a high-speed robotic cell, a buffer conveyor, and a manual inspection station. The initial digital twin used a dense grid with 200 sensors, but the team noticed that drift was worst exactly between the robotic cell and the buffer—a zone where sensors were plentiful but data was noisy.
They switched to a targeted zones strategy with 40 sensors at the robotic cell output, the buffer entry/exit, and the inspection station. They also introduced a virtual sensor that inferred buffer occupancy based on robot cycle time and conveyor speed. After three months, the throughput deviation had dropped from 4.2% to 1.1%, while data costs fell by 80%. The key was not that the sensors were fewer, but that they were placed precisely where the model’s state transitions were most sensitive to drift.
This example illustrates that the optimal sensor placement strategy is not an either/or decision—it is a systematic exercise in understanding which measurements most effectively constrain the digital twin’s uncertainty.
Avoiding Common Pitfalls in Sensor-Driven Validation
Even the best sensor placement strategy can fail if you fall into these traps. The first mistake is placing sensors based only on easy access or existing infrastructure. You are validating a model, not monitoring equipment—sensor locations should follow the model’s high-uncertainty regions, which may be in awkward or physically inconvenient places.
Second, do not ignore the temporal dimension. A sensor that samples every second may not capture an event that lasts 200 milliseconds. Ensure that the sampling rate is high enough to catch the dynamics that drive drift. The third pitfall is treating sensor data as ground truth without accounting for sensor error. You must fuse multiple data sources and use uncertainty propagation so that the validation process itself does not introduce bias.
Finally, beware of overfitting your digital twin to the sensor data. If you adjust the model to exactly match every measurement at a given moment, you may lose the ability to generalize to new conditions. Validation should nudge the twin toward physical reality, not eliminate all residuals.
Conclusion
Validating digital twin accuracy for factory layouts is a continuous process that depends more on strategic sensor placement than on raw sensor count. The comparison between dense grids and targeted zones reveals that no single placement works for every layout; the best approach is a hybrid, adaptive strategy that combines fixed critical-point sensors, temporary mobile sensors, and virtual sensors to maintain low simulation drift. By using the right accuracy metrics and revisiting sensor placement whenever the factory changes, you can keep the digital twin not just connected, but genuinely trustworthy.