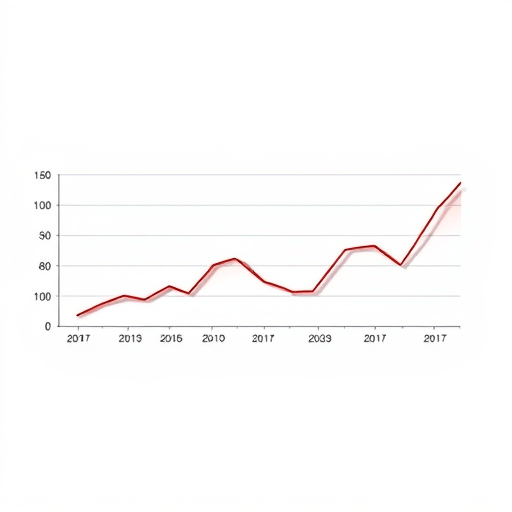
For years, SaaS founders have treated customer churn as the ultimate retention report card. Lose too many logos, and the narrative shifts from growth to survival. But as investors in 2026 reward efficiency over raw expansion, logo churn is losing its predictive power. In practice, contraction ARR — the recurring revenue lost when existing customers downgrade, reduce seats, or consume less — tells a far more accurate story. Put simply, this is why contraction ARR beats customer churn for SaaS growth, especially when analyzed through cohorts of customers who started at the same time and under the same pricing conditions.
Contraction arrives before churn does. A customer rarely cancels a contract on a whim; they first downgrade, reduce seats, or pause usage. That gives a finance team an early, measurable warning. By the time a logo actually leaves, the expansion opportunity has already evaporated, and the signal is too late to act on.
Customer Churn Is a Lagging Indicator
The standard retention metric, customer churn, is binary. A customer is either active or gone. But in B2B SaaS, revenue changes continuously. A startup that trims headcount may remove forty seats while keeping the account open. A mid-market company might drop from the enterprise tier to the professional tier during a budget review. Neither action appears in customer churn, yet both directly reduce monthly recurring revenue.
Churn is best understood as the final event in a sequence of smaller revenue decisions. When contraction ARR rises, logo churn typically follows two to three quarters later. Investors know this, which is why they now model contraction activity before they examine the list of canceled logos in a board deck.
What Contraction ARR Actually Measures
Contraction ARR quantifies the annualized revenue lost from existing customers who remain active. It deliberately excludes customers who cancel completely. Common sources include:
- Seat reductions in per-user pricing models
- Downgrades from higher-priced tiers to lower-priced tiers
- Usage-based pricing shrink when product consumption falls
- Renegotiations that extend terms in exchange for a discount
- Removal of paid add-ons, modules, or premium support levels
Each event reveals something meaningful about the product’s perceived value. A customer who removes seats is not rejecting the whole solution; they are signaling that the price-to-value ratio has weakened for their current situation. That is actionable intelligence that a simple churn metric can never provide.
Cohort Analysis: The Dollar-Weighted Truth
The clearest way to see why contraction ARR matters is to compare two hypothetical SaaS companies with identical starting revenue.
Company A signs one hundred customers at an average contract value of $1,000. Over the next year, eight customers churn completely. The remaining customers expand by 10% but contract by 3%. Company A’s net revenue retention lands near 99%: churn removes 8%, contraction removes roughly 2%, and expansion adds almost 10%. That is a healthy, growing base.
Company B signs the same kind of customers at the same average contract value. Only four customers churn. But a large share of the remaining base reduces contract size: contraction consumes 9% of starting ARR, while expansion adds just 4%. Company B’s net revenue retention falls below 91%, even though its customer churn rate is half of Company A’s.
The cohort analysis makes the problem obvious: the company that kept more logos is losing the revenue battle. Its headline churn rate looks flattering at 4% versus 8%, but the dollar-weighted truth is that the business is effectively shrinking while reporting better-looking retention.
Why Investors Track Contraction ARR Before Churn
Investors underwrite net revenue retention because it directly measures the health of the recurring revenue base. A company can lose 10% of its logos annually and still grow efficiently if expansion outpaces churn and contraction combined. The reverse is also true: a company with low logo churn can fail to grow once expansion slows and contraction rises.
There are three specific reasons investors watch contraction ARR so closely:
- It reveals pricing power. High contraction suggests customers feel the product no longer justifies its price.
- It exposes product stickiness. Low contraction during a downturn indicates the product is embedded in daily operations.
- It predicts cash flow pressure. Contraction hits current recurring revenue, and every point of contraction lowers the base on which future growth compounds.
In an efficiency-first capital market, investors would rather see stable gross retention and steady expansion than a flattering churn metric that masks revenue erosion inside the base.
How to Diagnose the Drivers of Contraction
Tracking contraction ARR is only useful when the underlying drivers are understood. For usage-based pricing, contraction tends to follow a decline in daily active usage, so product analytics should be reviewed alongside billing data. Seat-based products require attention to admin actions: a single bulk seat reduction is different from gradual attrition across dozens of accounts.
For tier-based pricing, contraction can point to a failed launch or an onboarding mismatch. If customers downgrade from the enterprise tier within the first two quarters, the premium features sold during the sales cycle were either not delivered or not adopted. In that case, contraction is a product responsibility, not just a commercial outcome.
Retention Metrics That Complete the Picture
No single metric tells the whole story. Cohort-level reporting should include both gross and net revenue retention:
- GRR: Starting ARR minus churn and contraction, divided by starting ARR.
- NRR: Starting ARR minus churn and contraction plus expansion, divided by starting ARR.
- Expansion ARR: Revenue added by existing customers through upsells and cross-sells.
- Contraction ARR: Revenue removed by existing customers who remain active.
When these metrics are stacked into monthly cohort tables, patterns become visible. A cohort that holds steady for six months and then contracts in month seven often points to an internal event — a budget cycle, a leadership change, or feature fatigue — that can be investigated before the next renewal.
From Contraction Signal to Expansion Strategy
Leaders who monitor contraction ARR can intervene before the damage spreads. Customer success teams can flag accounts with declining usage and offer targeted re-engagement before a downgrade is requested. Product teams can spot missing features that drive tier downgrades. Finance teams can adjust forecasts to reflect the contraction trend rather than assuming the base remains flat.
In the end, the goal is not simply to reduce customer churn. It is to preserve and grow the recurring revenue base. For SaaS companies operating in a budget-conscious market, contraction ARR is the earliest metric that reveals whether the existing customer base is gaining or losing economic momentum.
Conclusion
Contraction ARR beats customer churn for SaaS growth because it identifies the earliest point of revenue risk and reveals the specific behaviors that cause accounts to shrink. While churn reports how many customers left, a cohort-level analysis of contraction shows why the remaining revenue base is not compounding as quickly as it should. In the current SaaS climate, that distinction is what separates businesses that simply report retention from businesses that actually improve it.