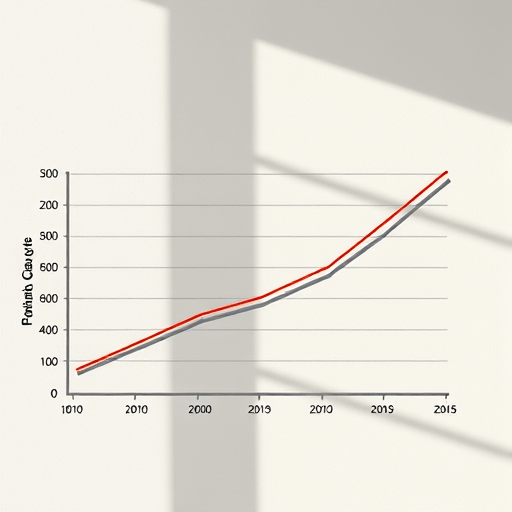
The shift to usage-based pricing has forced SaaS finance teams to rethink how they measure success. Yet many still lean on seat-based KPIs—metrics like revenue per seat, support tickets per employee, or gross margin per customer—as if the old per-user world never left. That mismatch is dangerous. If you calculate unit economics using per-seat averages, you will misjudge cost to serve, misprice high-volume customers, and miss expansion opportunities. The fix: track consumption cohorts instead of per-seat averages, because unit economics in a usage-based business are driven by how customers consume, not by how many employees they have.
As usage-based pricing matures in 2026, finance leaders are learning that the seat is the wrong denominator. It hides the real cost drivers, blends high-intensity and low-intensity users into a meaningless number, and makes it nearly impossible to forecast infrastructure spend. Consumption cohorts—groups of customers defined by how much they actually use, how their usage changes over time, and what mix of features they touch—offer a far more honest view of unit economics.
How Seat-Based KPIs Distort Consumption-Driven Unit Economics
Seat-based KPIs assume that every user is equal. In a usage-based model, nothing could be further from the truth. A customer with 500 employees might generate only 1,000 API calls per month, while a customer with 50 employees generates 10 million. Averaging those two customers into a “revenue per seat” figure tells you nothing about the cost to serve either one.
Consider three common seat-based metrics and why they break down:
- Revenue per seat ignores that high-volume customers often require disproportionate infrastructure, support, and onboarding. The average seat looks profitable, but the actual consumption curve may show deep losses at the upper tail.
- Support tickets per user penalizes companies with many low-usage seats, but the real support cost is tied to feature complexity, data volume, and integrations—not headcount. A small customer running complex automations can generate more tickets per dollar than a large customer using one simple endpoint.
- Gross margin per customer when calculated on a per-seat basis hides the fact that a customer’s margin is determined by cost per unit of consumption, not cost per user. If your infrastructure bill scales with API calls or gigabytes, then dividing by seats gives you a fictitious margin that no amount of cost cutting can fix.
The result is a distorted view of unit economics. You end up investing in acquisition channels that bring in high-seat, low-usage accounts, while missing the fact that your most valuable customers are the ones whose consumption grows into the top decile. And when a customer’s headcount drops but their API calls keep climbing, per-seat metrics may show contraction when the business is actually expanding.
Consumption Cohorts Are the New Unit-Economics Lens
Instead of grouping customers by employee count, consumption cohorts group them by usage behavior. You might define cohorts by monthly active API calls, gigabytes processed, compute hours consumed, or any other metered unit that drives your cost structure. The key is to track the same group of customers over time and watch how their consumption evolves—not just the average, but the distribution.
This approach reveals what per-seat averages hide: the shape of the curve. Some customers start small and grow fast. Others start large and decay. Some hover around a steady level of usage, while others spike seasonally. Each of these consumption cohorts has different unit economics, and each responds differently to pricing changes, packaging updates, and support policies.
Tracking consumption cohorts instead of per-seat averages lets you answer questions like:
- Which cohort has the highest gross margin per unit of consumption?
- Which cohort expands fastest over the first three months?
- Which cohort churns when usage drops below a certain threshold?
- Which cohort drives support costs out of proportion to its revenue?
Once you have those answers, you can make pricing and product decisions based on real economic signals. You can create onboarding flows that push new customers toward the usage pattern of your best cohort. You can set alert thresholds for accounts whose consumption is trending toward low-margin territory. And you can avoid the trap of optimizing for a fictional average account.
Which Cohort Metrics Actually Matter?
Switching from per-seat KPIs to consumption cohorts does not mean tracking every possible metric. It means focusing on the ones that connect directly to unit economics. These four are a strong starting point:
1. Gross Margin per Consumption Cohort
Calculate total revenue from a cohort minus the direct cost of serving that cohort, including infrastructure, support, and implementation. Divide by the number of consumption units, whether that is API calls, gigabytes, or seat-equivalent compute. This tells you whether the cohort is structurally profitable and how that margin changes as the cohort scales.
2. Median and Decile Usage per Account
Replace the average with median and percentiles. The median account in your usage distribution is far more representative than the mean, which can be skewed by a few hyperscale customers. Pay special attention to the P10 and P90 cohorts: they often behave so differently that they need separate pricing or support strategies.
3. Cohort Retention Weighted by Consumption
Measure not just how many customers stay, but how much consumption they retain. A cohort with 90% customer retention but only 60% consumption retention is declining—your customers are staying, but using less. That is a unit-economics red flag that per-seat churn metrics miss entirely.
4. Cost per Marginal Consumption Unit
At the cohort level, track how incremental usage changes your cost structure. Some cohorts may have a nearly flat cost curve after the initial setup, making them highly lucrative as they expand. Others may hit infrastructure thresholds that cause costs to jump. Knowing the marginal cost per cohort helps you price usage tiers and discount thresholds with confidence.
How to Build a Consumption Cohort Dashboard
Building a consumption cohort dashboard does not require a giant data team, but it does require clean event data and a clear definition of the consumption unit. Start with the metered event that is closest to your direct costs. For a data pipeline product, that might be rows processed. For an AI API, that might be tokens. For a cloud collaboration tool, that might be active compute minutes.
Once you have that unit, follow these steps:
- Define cohort boundaries. Group customers by usage level at the end of their first month, or by the pattern of usage over the first 90 days. Common cohorts include “low usage,” “medium usage,” “high usage,” and “spiky usage.” Avoid using employee count as a boundary.
- Assign costs to consumption. Work with your engineering and operations teams to allocate infrastructure costs and support costs to each metered unit. This is the hardest step, and it does not need to be perfect—a reasonable allocation is enough to expose the differences between cohorts.
- Track the same cohort over time. Dashboard tools like Looker, Power BI, or even a well-structured spreadsheet can work if you keep the cohort definition stable. Update monthly and look at how each cohort’s margin, retention, and consumption evolve.
- Act on the signals. If a cohort’s gross margin degrades above a certain usage threshold, consider introducing a new pricing tier or a cost-control feature. If a cohort expands after adopting a particular integration, double down on that path in onboarding.
One important caveat: do not overfit to a single dashboard. Usage behavior changes as your product changes. Review your cohort definitions every quarter and adjust them when you add major features or change your pricing metric. The goal is not to build a perfect model, but to replace misleading per-seat averages with a more truthful picture of which customers actually make you money.
The Unit Economics of Usage Grow in Cohorts, Not Seats
Seat-based KPIs were designed for a world where each user added roughly the same cost and roughly the same revenue. Usage-based pricing broke that world. When your costs scale with consumption, your unit economics must be measured along the same axis. By tracking consumption cohorts instead of per-seat averages, you can identify the customers who deserve more investment, adjust pricing before margin erodes, and finally see the real economic shape of your usage-based business. The average seat never told you that. The cohort curve does.