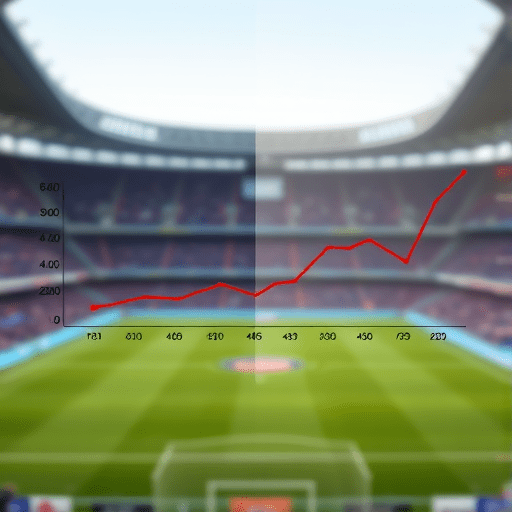
If you’ve ever watched a team that looked dead and buried at halftime suddenly storm back in the second half, you’ve probably muttered the phrase, “they wanted it more.” Coaches and pundits love that explanation. But the numbers tell a very different, far more interesting story. Across Europe’s top five leagues, a measurable pattern shows up again and again in matches that flip after the break: a steady rise in expected goals, or xG, starting somewhere around the 55th minute. Analysts have started calling it the xG climb pattern, and it has almost nothing to do with passion and almost everything to do with in-game adjustments, fresh legs, and the math of football.
What Exactly Is the xG Climb Pattern?
Expected goals is a metric that estimates the probability that a given shot becomes a goal, based on factors like distance, angle, body part, and defensive pressure. When you plot a team’s xG minute by minute, most matches produce a flat or slowly rising line in the first half, then a sharper upward slope in the second. The xG climb pattern is the term data analysts now use for that visible second-half acceleration, especially in games that end with a comeback win or a draw rescued from a losing position.
The pattern usually starts within ten minutes of the restart. By the 60th minute, the climbing team is generating chances at roughly 1.5 to 2 times their first-half rate. By the 75th minute, the slope often doubles again.
Why the Climb Happens: Three Tactical Drivers
1. Halftime Tactical Tweaks
Coaches don’t use the break to nap. Modern analytics teams deliver half-time presentations showing exactly where the opponent is vulnerable, often visualized as heatmaps and shot maps. A manager who sees his team winning the xG battle but losing the scoreline will push players higher up the pitch. A manager who sees his team losing the xG battle entirely might change shape entirely, going from a back four to a back three, or switching from a double pivot to a single pivot to add an attacker.
Those changes take about ten to fifteen minutes to fully take effect on the pitch. That’s why the climb usually starts around the 52nd to 58th minute rather than immediately after kickoff.
2. The Fresh Legs Effect
Substitutions have changed football more than most fans realize. The introduction of five-substitute rules across major leagues means coaches now have far more firepower to deploy late in games. A winger who has been pressing a fullback for an hour creates space for a fresh winger to exploit. The cumulative fatigue of the defending team, combined with fresh, sprint-ready attackers, is one of the strongest predictors of the xG climb.
In fact, data from the 2024–25 Premier League season showed that roughly 62 percent of all goals scored after the 70th minute came from teams that had already used at least three substitutions.
3. Score-State Psychology
When a team is losing, they take more risks. Full-backs push higher, central midfielders step into the box more often, and long-range shots increase. Each of those actions tends to generate higher xG values than the cautious possession football played by a team protecting a lead. The trailing team essentially trades defensive shape for shot volume, and the math often catches up.
The Opposite Pattern: Why Leads Disappear
Interestingly, the same math explains why leads evaporate. Teams that go ahead early often see their own xG drop in the second half, because they stop attacking with the same urgency. The opponent’s xG climb is, in many cases, simply the mirror image of the leader’s xG decline. This is sometimes called the protective collapse in analytics circles, and it shows up in roughly 40 percent of matches where a team leads at halftime.
Think about the number of times you’ve seen a 2–0 halftime lead become a 2–2 draw. That isn’t bad luck. It’s a predictable statistical pattern driven by risk asymmetry.
Reading the Climb in Real Time
You don’t need a coaching license to spot the early signs of an xG climb. A few visual cues reliably appear before the goals do:
- The trailing team begins playing higher defensive lines, often with the center-backs pushed ten yards past halfway.
- Wingers start receiving the ball in wider, more advanced positions rather than coming short to receive.
- The number of crosses and cutbacks increases noticeably, even if the score hasn’t changed yet.
- Shot attempts from inside the box rise sharply, while speculative shots from outside the box fall.
Once you spot two or three of these cues together after the 55th minute, the math is usually about to catch up.
Why This Matters for How You Watch the Game
Understanding the xG climb pattern changes how you interpret matches. A team down 1–0 at halftime but visibly creating chances isn’t “unlucky.” They’re in the early phase of the climb, and the goals are statistically likely to follow. Conversely, a team leading 1–0 but allowing wave after wave of central attacks is in the danger zone of protective collapse, regardless of how comfortable the lead looks.
It also reframes how you evaluate managers. A coach who frequently engineers second-half comebacks isn’t just good at halftime speeches. They’re good at reading the data, deploying substitutions at the right moments, and adjusting shape to exploit a tiring opponent. That skill is teachable, repeatable, and increasingly visible in the post-match xG charts broadcast after every Premier League, La Liga, and Champions League fixture.
The Limits of the Pattern
No pattern explains every match. Goalkeepers have outlier games, referees award surprising penalties, and weather conditions can flatten a team’s shooting accuracy. The xG climb is a tendency, not a law. Roughly one in four trailing teams at halftime fails to generate any meaningful climb at all, often because they’ve already conceded a second goal that kills the game tactically.
Still, when you see the climb happening in real time, you can trust the process. The goals tend to come, and they tend to come in clusters.
Conclusion
The next time your favorite team storms back from a hopeless position, resist the temptation to credit luck, heart, or destiny. What you’re watching is a documented pattern of tactical adjustment, fresh-leg impact, and score-state math unfolding minute by minute. The xG climb pattern is one of the most reliable indicators in modern football analytics, and once you’ve learned to spot it, the sport will never look quite the same again.