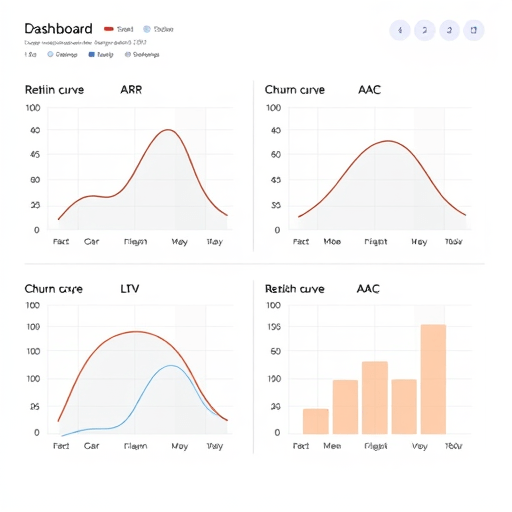
Most founders trust their dashboards. The ARR is climbing, retention looks healthy, customer acquisition cost is steady, and lifetime value keeps getting better. Then the cash runs out, gross margin silently shrinks, or investors start asking uncomfortable questions. The trouble usually starts not with a single bad number but with metrics that quietly disagree with each other. As finance, product, and growth teams enter 2026 with tighter capital discipline and sharper investor scrutiny, the ability to decode these conflicts has become a core operating skill for any SaaS leader.
Why Disagreement Between ARR, Churn, LTV, and CAC Is a 2026 Red Flag
For years, the SaaS playbook rewarded growth at almost any cost. Today, the conversation has shifted. Public market comps, secondary markdowns, and tougher fundraising conditions mean that founders can no longer dress up top-line momentum while quietly bleeding gross margin. Conflicting metrics are often the first warning of structural weaknesses that dashboards alone will not reveal.
- Capital efficiency now matters as much as growth rate. Buyers and boards are probing whether each new dollar produces durable, profitable revenue.
- AI-native competitors have reset churn expectations. Even sticky products see expansion get more fragile as switching costs fall.
- Multi-product and bundling strategies complicate cohorts. Customers acquired for one product now flow through several monetization paths.
- Macroeconomic softness lengthens sales cycles. This distorts CAC payback readings and inflates the apparent value of pipeline.
Recognizing these shifts, it becomes clear that looking at metrics in isolation is what creates trouble. The risk is not the number itself, but the gap between what two numbers are telling you.
The Three Core Metric Conflicts That Hide the Most Damage
Not every disagreement matters. Some are noise. Others reflect real, ongoing damage. These three patterns come up again and again in healthy-looking SaaS businesses.
1. Rising ARR Paired With Stubbornly High Churn
If ARR is going up but logo or gross revenue churn stays elevated, the growth is being funded by replacement, not expansion. New logos are filling the bucket faster than existing customers are leaving. That works in a hyper-growth market, but it means customer success is structurally failing, and future acquisition costs will compound as the same customers must be replaced, or worse, acquired again after churning out.
The diagnostic move is to compare net new ARR growth against weighted gross churn. If you are losing 2 percent MRR per month but adding 3 percent from new logos, your net growth is small, your payback math is fragile, and any slowdown in demand hits hard.
2. Strong LTV/CAC Ratios Masking Poor Payback Periods
A 5x LTV/CAC ratio is celebrated in board decks, but if CAC payback stretches beyond 24 months, the business is effectively borrowing growth from future cash flow. In higher rate environments, this becomes punishing. The conflict here is between a long-horizon ratio that looks great on paper and a short-term cash reality that is unsustainable.
Look at CAC payback by channel. You may find that paid search and content are healthy, while events and partnerships are dragging payback toward three years. The blended metric is masking underperforming segments, and the smartest operators in 2026 are reallocating budgets quarterly based on payback, not just lead volume.
3. Healthy Net Retention Hiding Weak Unit Margin
Expansion can inflate NRR without improving the underlying business. If expansion comes mostly from discounting upgrades, multi-year prepayments, or heavy services attach, you are buying retention rather than earning it. At the same time, COGS to serve that expansion may be rising because human support hours scale with usage rather than revenue.
The fix is to separate price-driven expansion from volume-driven expansion, and to evaluate fully loaded gross margin per cohort rather than company-wide gross margin. Cohorts acquired last year often have a 10 to 15 point margin gap compared to those from two years ago.
A Practical Framework for Resolving Metric Conflicts
When metrics disagree, the answer is rarely to fix one of them. It is to redesign the model so the numbers talk to each other. This four-step framework has proven useful across B2B SaaS companies from Seed to Series C.
- Decompose every aggregate into its drivers. Total ARR is meaningless without new, expansion, contraction, and churn components. Build the dashboard from the ground up.
- Layer in time horizons. TTM, trailing six months, and trailing 30 days each tell different stories. Many of the conflicts only show up when you align the period correctly.
- Segment by motion and customer type. Enterprise, mid-market, and SMB rarely behave alike. Industry, product line, and geography can each create independent unit economic profiles.
- Stress-test against scenarios, not averages. Model what happens if churn doubles or CAC rises 20 percent. If the model collapses, you have found a hidden dependency.
Common Hidden Risks That Surface Once You Reconcile the Model
Reconciliation tends to reveal the same handful of recurring risks. Being explicit about them up front makes them easier to catch.
- Discounting creep: Average effective price per seat slowly falls over 18 to 24 months, eroding LTV in ways headline ACV hides.
- Product-led self-serve cannibalization: Free and trial users grow fast, but paid conversion and ARPU on converted users drop because the wrong personas sign up.
- Channel conflict: Direct sales, partners, and self-serve each have different CAC, but revenue is reported on a single line.
- Implementation and onboarding drag: Time-to-value extends, TTV slips, and churn rises in cohorts that should be stable.
- AI integration costs: Inference and model usage can quietly degrade gross margin in ways that only show up when modeled against customer usage patterns.
How Leading Operators Build a Conflict-Aware Operating Cadence
The companies that avoid these traps do three things consistently. They review metrics in conflict-aware formats, they pair finance and product leads in every cohort review, and they insist on a single source of truth that reconciles billing, CRM, and product data weekly rather than monthly. This last point is increasingly non-negotiable as usage-based and hybrid pricing models make attribution harder.
It also helps to externalize the diagnostic process. Many boards now expect a unit economics walk each quarter that explicitly compares the four key metrics side by side and explains divergences, rather than presenting each one in isolation. Boards that previously wanted a single growth narrative now want a clear picture of how growth is composed and what trade-offs the team has chosen.
Healthy SaaS businesses in 2026 will not necessarily post the highest growth rates or the cleanest individual metrics. They will be the ones whose dashboards are internally consistent, whose conflicts are explained rather than hidden, and whose leaders treat metric disagreement as the most valuable signal they receive. Treating ARR, churn, LTV, and CAC as a system rather than four separate KPIs is the difference between a SaaS company that scales durably and one that scales only until the next funding cycle ends.