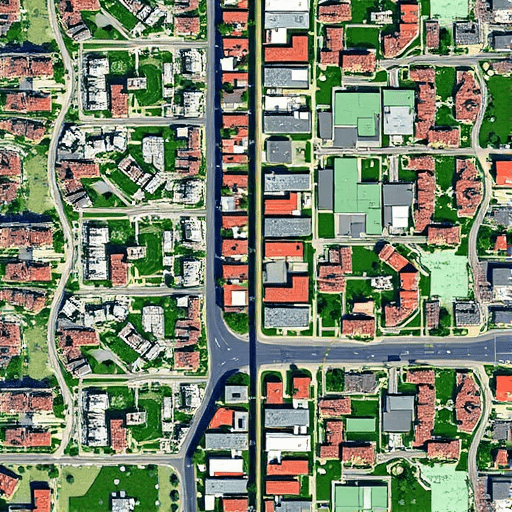
Most travelers rely on Instagram feeds and forum threads to choose where to stay or explore, but those sources rarely reveal the subtle details that separate a genuinely interesting neighborhood from a generic tourist hub. If you want to spot hidden gems from satellite images before you visit, free GIS tools give you a superpower: the ability to read the urban landscape like a local from above. By layering satellite imagery with open geodata, you can uncover quiet green courtyards, lively corner plazas, the real direction of foot traffic, and even future development signs—all before you book a room.
This approach isn’t about being a digital detective; it’s about using the same spatial analysis tools that urban planners and geographers use, but for your own travel planning. Best of all, you don’t need expensive software or a GIS degree. A few free web-based platforms and a bit of observational practice are enough to transform your pre-trip research into a rich, multidimensional map of your next destination.
Why Satellite Scouting Beats Reading Neighborhood Reviews
Reviews and blog posts are written by people with different tolerances for noise, crowds, and aesthetics. A “charming” street in one review might be a car-choked thoroughfare to someone else. Satellite images are objective—at least regarding physical features. You can see exactly how wide the sidewalks are, how many trees shade a plaza, whether buildings have active ground floors with wide windows, and how much empty land sits between attractions.
Moreover, free GIS tools let you combine imagery with data layers that are impossible to get from a photo on social media. For example, OpenStreetMap (OSM) data can reveal bike lanes, pedestrian paths, drinking fountains, and benches—tiny but crucial details for enjoying a neighborhood without constantly checking your map. When you mentally overlay satellite imagery with these data, a rough idea becomes a clear mental model of the area.
The Best Free GIS Layers for Neighborhood Reconnaissance
To get the most out of your satellite scouting, you don’t need to master heavy desktop GIS software. Start with these free tools and layers:
- Google Earth Pro (desktop) – The best free tool for interactive 3D terrain, building shadows, and historical imagery. Its “Vintage” slider lets you compare imagery from different years, which is perfect for spotting gentrification hotspots.
- QGIS with the HCMGIS plugin – A free open-source mapping suite. With the HCMGIS plugin, you can instantly load basemaps from Google, Bing, and Esri, then add OSM vector data such as land use, leisure areas, and points of interest.
- Overpass Turbo – A web-based query tool for OpenStreetMap. You can extract every bench, water fountain, or restaurant terrace within a polygon, then export the results as a KML file to view in Google Earth.
- Sentinel Hub Playground – Access recent and archival Sentinel-2 satellite imagery at 10-meter resolution. Great for analyzing vegetation health (NDVI), water bodies, and even beach sediment changes.
- Google Maps’ “Satellite” view with street view peeking – Not a GIS tool per se, but effective for cross-referencing vertical imagery with ground-level reality when you zoom in on a specific block.
Read the Urban Canopy: Trees, Shadows, and Green Space
One of the easiest ways to spot a hidden gem is by looking at tree cover and shadow patterns. In dense, older districts, a block with a thick canopy of trees often indicates a quieter, more established residential fabric. Use Google Earth Pro’s sunlight-based 3D mode to see how shadows fall at midday; large south-facing shadows in the northern hemisphere mean cold, dark streets in winter, while east-west streets with tree shadows on the sidewalk suggest a pleasant morning or evening stroll.
Aerial green space is another clue. A small pocket park hidden between apartment blocks won’t appear in many travel guides, but satellite imagery reveals its exact shape, seating areas, and whether the grounds are kept. Compare that with the OSM layer for “leisure=park” and you’ll often find unofficial green spots—like empty lots turned into community gardens—that never appear on paper maps.
Decode Traffic and Parking Patterns from Above
Satellite imagery is a freeze-frame of daily life. If you examine parking lots and street parking, you can infer activity cycles. For example, a residential street with many cars at midday might indicate working-from-home residents or, conversely, a popular lunch spot with office workers. A parking lot that is almost empty on a Tuesday afternoon in August could signal seasonal businesses or a beach area that thrives only on weekends.
Look at the width of roads and the presence of bike lanes. Narrow, tree-lined streets with integrated bike paths are usually calmer and more walkable. Broad avenues with multiple lanes and sparse crossing options point to car-dependent areas. Free GIS tools like OSM’s bike layer on the main Overpass Turbo interface allow you to visualize the bike network as a separate layer, highlighting safe routes to hidden gems that you might otherwise miss if you were following a vehicle-based navigation app.
Spot Social Hotspots and Hidden Amenities
Beyond static features, GIS data can hint at where people actually gather. OpenStreetMap tags for “amenity=cafe,” “amenity=restaurant,” and “shop=convenience” show commercial clusters. But more revealing are the small “leisure” tags: sports pitches, playgrounds, dog parks, and outdoor fitness stations. A neighborhood with three playgrounds and a basketball court within a few blocks is likely family-oriented and sociable. A cluster of small restaurants with outdoor seating near a pedestrian square will appear as a dense constellation of building footprints and overlapping roof shapes—often with colorful umbrellas that show up as tiny colored pixels in high-resolution imagery.
Another hidden-gem signal is the presence of a farmers market or a weekly street market. Many markets set up in parking lots or empty plazas, so if you see a large paved area with no permanent structures, check its current condition and local event listings. Satellite images taken on different days of the week will show dramatically different patterns—a weekday view may be nearly empty, while a Sunday view reveals rows of white tents or crowded stalls.
Use Historical Imagery to Predict Change
Free GIS tools often include access to historical imagery, which is a goldmine for trend-spotting. In Google Earth Pro, the clock icon opens a timeline of satellite and aerial photographs. Slide back five or ten years and compare the same intersection. If you see new apartment buildings, a renovated plaza, or a reclaimed car park turned into a pocket park, that block is in transition. For a traveler, this means better amenities, but also potentially higher prices and more construction noise.
Historical images also reveal seasonal variations. Coastal areas, in particular, change with sandbars and tidal pools. By comparing late-summer and early-winter imagery, you can identify which beaches stay wide and which disappear underwater—a crucial detail for a beach town visit. Similarly, snowy winter imagery can show which roads are cleared first, an indicator of their priority and frequency of use.
A Step-by-Step Workflow for Your Next Trip
You don’t need to be an analyst to use these techniques. Follow this simple workflow:
- Define your search area – Draw a rough polygon around the part of the city you’re considering, based on walking distance from your accommodation or major transit stops.
- Load satellite layers – In QGIS, use the HCMGIS plugin to add Google or Bing imagery as a base layer, and enable OSM buildings and land-use layers.
- Query for leisure and amenities – Open Overpass Turbo, select your polygon, and run a query for
leisure,amenity, andshoptags. Export the result as a KML and open it in Google Earth Pro over the basemap. - Slide the historical timeline – Use Google Earth Pro’s historical slider to see how the area has changed over the last five to ten years. Note any vacant lots or construction sites.
- Check shadows and greenness – Use the 3D view to see building heights and shadow patterns. In Sentinel Hub Playground, toggle the NDVI layer to see which areas are lush and alive.
- Ground-truth on Street View – For the top two or three candidate spots, drop the little Pegman into the map to get a ground-level perspective. This verifies that the space isn’t just green on satellite but also visually pleasant.
Once you’ve done this exercise, you’ll arrive with a mental map that most locals would envy. You’ll know which corner has a bench facing a sunset, which alley leads to a quiet courtyard, and which block is worth skipping because its sidewalk is too narrow or its parking lot too dominant. That’s the real value of using free GIS tools for pre-travel reconnaissance—you’re not just looking at a map; you’re reading the city’s physical story before you walk its streets.
Conclusion
Moving from scrolling photos to actively analyzing satellite imagery changes the way you plan a trip. With free GIS tools like Google Earth Pro, QGIS, Overpass Turbo, and Sentinel Hub, you can uncover a neighborhood’s hidden personality—its green nooks, pedestrian flows, market rhythms, and signs of change. The next time you’re about to book a place, spend an hour zooming into the blocks around it. You’ll likely discover a hidden gem that no travel guide ever mentioned, and you’ll arrive like a local who already knows where the afternoon light hits the best bench in the park.