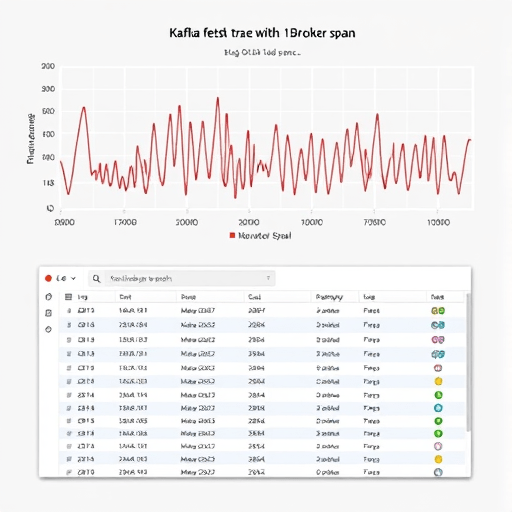
It started with a familiar symptom: Kafka consumer lag climbing for no clear reason. The logs said everything was fine. Metrics said the consumer was healthy. Yet messages stopped moving fast enough, and the usual debugging playbook only made things worse. The only reason we found it is that trace-only debugging caught Kafka lag logs missed, exposing a 150ms broker stall hidden inside a normal-looking fetch path. This postmortem tells the story of that incident and explains why log aggregation never surfaced the stall—and why we now treat traces as the first line of defense.
The Symptoms: Kafka Consumer Lag With No Log Signature
At 14:03 UTC, the lag monitor for the payments-finalized topic crossed the 500-message threshold. The consumer group, payment-sink-v2, had been processing at a steady 3,000 messages per second. By 14:05, lag had grown to 12,000 messages. The platform team opened the usual dashboards: consumer CPU, heap, GC pauses, poll intervals. None were elevated. The application logs showed no exceptions, no timeouts, no rebalances. We checked broker logs as well: no unclean leader elections, no ISR shrinks, no disk pressure alerts.
Everything looked healthy, and yet messages were not being consumed fast enough. That contradiction is exactly what makes Kafka lag such a cruel symptom: it is a metric, not a reason. Logs are usually the first place people look for reasons. In this case, logs had nothing to say.
Why Log Aggregation Couldn’t See the Broker Stall
Log aggregation is an event-driven view of the world. It records what happened—a log line, an error code, a state change. It is terrible at answering a different question: how long did a particular request wait? A 150ms stall on the broker may not produce a single log event if no threshold is crossed and no exception is thrown. The consumer’s poll() call simply returned 150ms later than usual.
- Logs are emitted by application code, not by the network path between client and broker.
- Log pipelines are batched and buffered, so short-lived stalls often rotate out before they are indexed.
- Logs usually record errors, not durations; successful slow requests remain invisible by default.
There is a deeper issue: logs are often produced by the application, not by the network path between the application and the broker. A Kafka fetch request is a bit like a round trip to a restaurant. The application log might say “order delivered,” but it cannot see when the kitchen stalled. To see the stall, you need a trace.
Trace-Only Debugging: Following the Request Across the Broker
After 40 minutes of log diving, we switched to trace-only debugging. We had OpenTelemetry instrumentation on the Kafka consumer client, but it was mostly used for HTTP request correlation. We had never used it for a Kafka-only incident. That changed quickly.
With a single trace query, we pulled all consumer.poll spans for the consumer group in the affected window. The span list immediately told a different story from the logs. The p50 poll duration was 48ms. The p99 was 235ms. And for a two-minute period, there were repeated spikes at 150ms above the baseline. Those spikes aligned perfectly with the lag growth curve.
Trace-only debugging means relying on span data alone to localize a fault. We did not add new logs, did not change code, and did not restart anything. We simply followed the spans. The fetch spans showed that the extra time was not in the consumer’s processing code, but in the Kafka client’s send-and-receive path. We then drilled into the sibling spans: each slow fetch had a matching span on the broker side, with a peer address pointing to broker-3.
The 150ms Broker Stall: What Actually Happened
Once we focused on broker-3, the trace data exposed the root cause. Kafka’s request handler thread was blocked for 150ms waiting for a file lock during a log segment flush. A log cleaner thread on a different partition had triggered a synchronous fsync because the cgroup for Kafka’s disk I/O had reached its writeback throttle limit. The kernel delayed the fsync for 150ms. Every fetch request for the payments-finalized partition that hit that handler had to wait for the lock to release.
The stall was just below our alert thresholds. Our broker-side latency alert fired at 500ms, and the 95th-percentile fetch latency only reached 280ms for about 90 seconds. The log line from the flush operation—something like completed flush of log /var/kafka/payments-finalized-3—was at INFO level and was not correlated with any error. In the trace, however, the flush span and the fetch span were linked through the same handler thread, with waiting states clearly visible.
It was not a typical Kafka failure. There was no partition offline, no leader switch, no network partition. The broker was alive, the topic was writable, and the consumer was never kicked out of the group. But the 150ms stall happened several times per minute for 20 minutes, and that was enough to push lag from near zero to hundreds of thousands of messages before the next compaction cycle.
Why Distributed Tracing Found It in Minutes
Logs say “what happened”; traces say “how long did everything take, and where did that time go.” The distinction matters for latency-induced lag. Distributed tracing is purpose-built for seeing the shape of a request across every hop: consumer, client library, network, broker handler, disk flush, and response.
In this postmortem, the crucial span was not an error span. It was a success span that took longer than expected. Log aggregation often filters out successful operations, which is exactly why it missed the stall. Tracing retains latency metadata for every sampled span, including successful ones. That allowed us to compare the slow fetch spans against a baseline and spot the anomaly.
We also used trace attributes to filter by messaging.system=kafka, messaging.destination=topic, and messaging.kafka.client_id. This is the kind of query that log aggregation could not answer without explicit log lines at every layer. And even then, those log lines would not have been correlated across broker and consumer because they would not share a trace ID.
Making Trace-Only Debugging Standard for Kafka in 2026
The incident changed how we debug Kafka. We no longer start from logs when lag appears without an obvious consumer error. We start from traces. This is not a rejection of logs—they still provide context, error messages, and audit trail. But logs are no longer the primary signal for latency issues.
In 2026, distributed tracing is no longer an exotic tool reserved for microservice request paths. Kafka clients and brokers can emit OpenTelemetry spans natively, and trace backends can store and query high-cardinality latency data at scale. For any Kafka consumer group that matters, we now enforce a trace sampling policy that captures at least 10% of all poll and fetch spans, and 100% of spans with duration over 100ms. We also changed our alerting: instead of only alerting on log error rates, we alert on trace-derived p99 fetch latency and on deviations from a baseline.
The 150ms broker stall would have gone undetected again if we had kept a log-only debugging culture. The metrics dashboard would have kept showing lag, and the logs would have kept showing nothing. Traces gave us the missing dimension of time.
Conclusion
The next time Kafka lag appears without a log explanation, resist the reflex to add more log lines. Follow the request itself. In this production postmortem, trace-only debugging caught Kafka lag logs missed by surfacing a 150ms broker stall that log aggregation never saw. Distributed tracing turned a 40-minute firefight into a 10-minute root cause analysis—and it gave us the foresight to prevent the next stall before it becomes a page. Logs will always have a place, but for Kafka latency, the trace is the truth.