Every Sunday, the box score tells you that a cornerback allowed three catches for forty yards. It does not tell you that those catches came on perfectly placed throws into windows that never should have been open. This fans’ guide to player tracking is built for that exact frustration: learn how to use Next Gen Stats to judge defense when the box score lies. The NFL’s tracking data has matured well beyond flashy animated lines on television. It now gives fans a way to measure pass rush burst, coverage tightness, and tackling quality in ways that were once reserved for coaches watching All-22 film. In 2026, the gap between what broadcasts show you and what actually happened on a play has never been wider — but player tracking can close it.
Why the Box Score Lies About Defense
Traditional defensive stats are a mix of opportunity and happenstance. A sack is a great event, but it says little about how often a defensive end beat his blocker. Interceptions are often tipped balls or poor decisions by quarterbacks. Tackles can be made after a six-yard run. The box score rewards production and ignores process. Player tracking data, on the other hand, measures every movement. It knows when a receiver creates separation, when a defensive back breaks on the ball, how fast a pass rusher accelerates, and how many yards after contact a tackler allows. These are the underlying variables that shape outcomes. If you want to judge defense before a media narrative solidifies, you need those variables.
Metric #1: Pass Rush Get-Off Time — First-Step Burst Broadcasts Rarely Show
Pass rush get-off time is the time between the snap of the ball and the instant a pass rusher begins his forward movement. It is the closest thing to a starting gun for defensive linemen. Most broadcasts treat pass rush as sacks, pressures, and hits — but those are finish lines. The explosive first step is what wins the race, and Next Gen Stats tracks it in hundredths of a second.
A defensive tackle with a 0.68-second get-off time consistently disrupts the timing of a play before the quarterback is even halfway through his dropback. A pass rusher with a slower get-off but a high sack total might be cleaning up pressures created by other players, or benefiting from a scheme that sends blitzers at the perfect moment. When you watch a live broadcast, you rarely see the subtle difference in immediate burst. The replay might show a lineman pushing the pocket, but it will not tell you whether he fired off the line at an elite rate or simply reacted after the center’s snap cadence gave it away.
How to use it: on the Next Gen Stats player page, look at a defensive lineman’s average get-off time over a season or within a single game. Compare it to the league average — around 0.75 seconds for interior linemen and slightly lower for edge rushers. A defensive tackle living below 0.70 seconds is a perpetual nuisance. When the sack numbers do not match the get-off numbers, that lineman is one bad quarterback decision away from a breakout for which he has already laid the groundwork. Broadcasters miss this metric because it does not fit into a highlight package, but it is far more predictive than a lucky strip sack.
Metric #2: Separation Allowed at Target — The Coverage Metric Broadcasts Overshadow
Cornerbacks are judged by interceptions and passes defensed, but those stats are conditional. A corner who excels at staying inside the receiver’s frame might only be targeted four times per game because quarterbacks look elsewhere. When he is targeted, the windows are tiny. That is coverage. The Next Gen Stats tracking metric called separation measures how much space exists between the receiver and the nearest defender at the moment the target arrives.
For defenders, the key number is separation allowed at target. The lower the separation number, the tighter the coverage. A corner who allows less than 1.0 yard of separation on average is locking down his side of the field, regardless of whether he gets his hand on the ball. Broadcasters, however, will replay a pass breakup with awe while ignoring the three prior plays where a receiver was open by three yards and the quarterback simply misfired. That is not good coverage; it is fortunate incompletion.
When using Next Gen Stats to judge defense, look at separation allowed on incompletions versus completions. If a defense’s cornerbacks are allowing low separation but still giving up catches, the ball is often arriving faster than the route needs, and that is a credit to the coverage. The box score sees a completion. Tracking sees a well-covered target struck by a perfect throw. This is the kind of nuance that turns a casual fan into a savvy analyst.
Metric #3: Expected Tackles and Tackle Efficiency — Tackles Can Be Too Late
Linebackers with 100+ tackles look like defensive anchors. But some tackles happen after a six-yard gain and a missed first contact. The third tracking metric broadcasts routinely miss combines expected tackles and tackle efficiency.
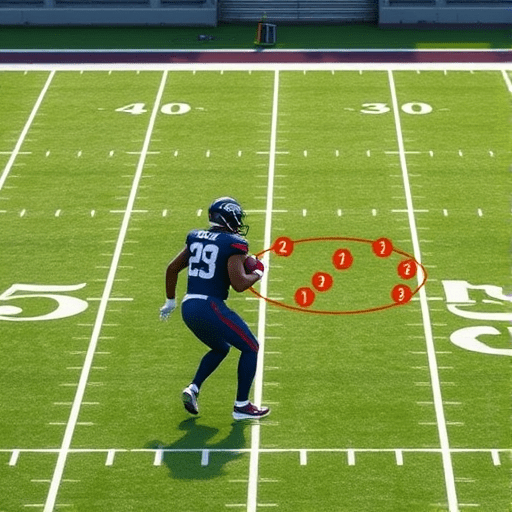
Expected tackles is a modeled value based on the situation: the ball carrier’s speed, angle, down, distance, and proximity of support. If a defender makes a tackle, Next Gen Stats can calculate whether that tackle was made earlier than an average defender would have, or later. A tackle that is made two yards before the expected stop point is a successful play. A tackle made three yards after the expected stop point is a failure disguised as a statistical positive.
This metric exposes players who take bad angles or fail to wrap up. A safety with a high expected tackle number but low tackle efficiency is often arriving late and relying on auxiliary help. In the box score, he gets credit for the solo stop; in tracking data, he loses points for the yards collected before the stop. Defenses are not just judged by whether they stop the ball carrier, but by how quickly they kill the play. Player tracking turns “tackle for no gain” from anecdote into a repeatable skill set.
When watching a game, listen for broadcasters praising a linebacker for leading the team in tackles. Then check his tackle efficiency after the game. If it is below 55%, many of his tackles are cosmetic. A run-stop at the line of scrimmage on third-and-inches matters much more than a tackle after a five-yard gain. This is where Next Gen Stats becomes your reference official.
How to Build a Weekly Defensive Tracking Routine
Using all three metrics together is better than looking at them in isolation. Before next Sunday, create a simple checklist:
- Pick five defensive players you care about, preferably at edge rusher, cornerback, and linebacker.
- Note their season averages for pass rush get-off time, separation allowed at target, and tackle efficiency.
- During the game, ignore the box score for those players and watch for moments that align with high-value tracking behavior: a defensive tackle knifing into the gap, a corner staying glued on a crossing route, a linebacker meeting the ball carrier before the second level.
- After the game, pull up the Next Gen Stats player dashboards and compare your visual observations with the tracking numbers.
Over a few weeks, you will develop the ability to see the game the way tracking data sees it. That is the real gift of player tracking: it trains your eye to look beyond the play’s result and toward the process.
What Broadcasts Still Owe the Fan
Broadcast teams excel at storytelling and drama, but they rarely have time to unpack the tracking layer. Occasionally you will see a Next Gen Stats graphic showing a receiver’s speed or a quarterback’s completion probability, but those nuggets are often surface-level. Defense remains a blind spot because defensive excellence is many small wins that never show up as a splash play. A perfectly timed pass rush, a tightly covered route, and an immediate tackle are not the moments that go into a halftime highlight reel.
This season, when the box score says a defense played well, pause before accepting it. Use next-gen numbers to judge whether a sack was really a product of individual brilliance or a broken screen that worked out. Let the tracking data be your fact-checker.
Conclusion
Player tracking just gave fans something no previous generation had: a way to see defensive performance with the same depth as a coach. By focusing on pass rush get-off time, separation allowed at target, and tackle efficiency, you can move past the box score and understand the play-by-play truth. The box score will still tell you what happened; Next Gen Stats tells you how and why. That difference is what separates a casual fan from a truly informed one.