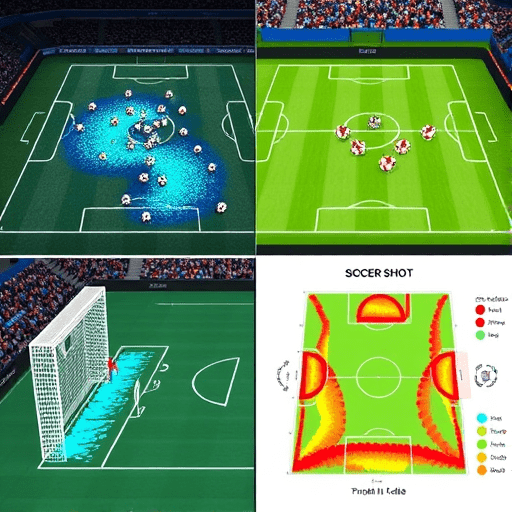
If you are trying to explain expected goals to basketball-first fans, start with something they already trust: shot quality. A pull-up three from 30 feet is not the same shot as an open corner three, even if both go in. Basketball fans have internalized that idea through expected points, shot charts, and tracking data. Expected goals, or xG, is the football version of that same concept — a way to measure how good a scoring chance is before the ball hits the back of the net.
The old way of talking about soccer made it sound like only the final result mattered: a goal is a goal. But tracking data changed that. In basketball, player-tracking systems log the shooter’s location, defender distance, time since the catch, and whether the dribble was live. Football analytics now uses the same kind of spatial data to turn every shot into a probability. Once basketball-first fans see that xG is basically a shot chart with a percentage attached, the whole idea clicks.
Think of xG as a Soccer Shot Chart on a 0-to-1 Scale
In basketball, a layup is worth more than a contested mid-range jumper because the expected points per possession are higher. Expected goals maps football onto that exact logic. Every shot gets a number from 0 to 1: 0 means it almost never goes in, 1 means it should be a goal every time. The number is not a prediction of what happens; it is a measure of the chance’s quality based on where the shot comes from, how it is struck, and who is around the shooter.
Use basketball examples to make it concrete. A wide-open layup is an extremely high-value shot — in soccer terms, that is a central shot from close range with the goalkeeper off balance. A contested deep three is a lower-value shot — in soccer, that is a long-range strike with a defender closing out. A half-court heave at the buzzer is the basketball equivalent of a shot from 40 yards out with no real plan. xG simply expresses those differences in a single number.
The Same Tracking Data That Powers NBA Analytics Also Powers xG
Basketball-first fans know that modern analytics is not just about points per game. The NBA’s tracking cameras log every possession, so analysts can break down how many defender feet are between a shooter and the rim. Soccer now has the same layer of detail. Optical tracking systems follow every player, the referee, and the ball. Feed that information into a model, and you can ask questions like: How close was the nearest defender? Was the shot taken from a bad angle? Was the ball moving at speed or bouncing awkwardly?
That is why xG feels so familiar to someone coming from basketball. It is not some mystical football statistic. It is the product of the same kind of raw data that powers expected points and defensive matchup reports. In football, a shot from the edge of the six-yard box after a cutback is the equivalent of an open catch-and-shoot three after a beautiful swing pass. The tracking data does not care that one sport uses feet and the other uses hands — it just records the geometry and pressure of the scoring chance.
Expected Goals Separate the Process From the Scoreboard
Basketball fans grew up hearing that good shots sometimes miss and bad shots sometimes go in. The same logic applies to soccer. A player can score a stunning goal from 30 meters, but if that shot never goes in more than a few times out of a hundred, the process was still poor. The highlight reel says “goal.” The tracking data says “low-value chance that happened to land.”
This is where expected goals is a genuinely useful translation tool. In basketball, you would not run a set play at the end of a game to get a contested fadeaway from the free-throw line just because a player once made one. You would design a play to get a layup or a wide-open three. xG does the same for soccer: it rewards teams for creating central chances close to goal and punishes teams for living on long-distance prayers. When a basketball fan watches a soccer team take twenty shots but lose 1–0, xG helps them see whether the team, like an opponent that kept hitting difficult mid-range jumpers, was relying on high-variance offense.
Defensive Pressure Is Already Built Into the Model
One of the biggest mental barriers for basketball-first fans is asking: “Why is a shot from the middle of the box not always a great chance?” The answer is pressure. In basketball, an open corner three is very different from a corner three with a defender flying in at the shooter. Soccer is no different. A header from six yards out is only a high-xG chance if the center-back is not leaning into the striker and the goalkeeper is not positioned directly in front of the ball.
Tracked defender distance is the most important bridge between the two sports. In the NBA, analysts use “defender distance at shot attempt” to separate open, contested, and heavily contested shots. In football, xG models use the same idea: how far is the nearest defender, and is the goalkeeper in a position to make the save? A shot that ends up in the side of the netting from a tight angle can produce a low xG because the geometry of the goalmouth is small, just like a driving layup from under the basket becomes a much harder shot when a rim protector is waiting.
Possession Value: From NBA Half-Court Sets to Football’s Final-Third Entries
Basketball fans know that not all possessions are created equal. Transition offense is worth more than grinding against a set half-court defense. The same thinking sits underneath xG. A soccer team that wins the ball high and attacks before the defense is organized generates more high-quality shots than a team that routinely passes sideways around a low block. Tracking data can connect those patterns: a fast-break in soccer often leads to a shot with more space and a higher xG.
You can push the analogy further. In basketball, a possession that ends with a corner three or a rim shot is often the product of a good offensive system. In soccer, a possession that ends with a cutback from the byline or a pull-back to the top of the box is the same kind of repeatable offense. Expected goals captures the value of those patterns by measuring the shot probability at the end of the sequence. For a basketball-first fan, thinking about a possession’s expected value is second nature. xG is just the soccer version of the same ledger.
A One-Sentence Translation for Basketball-First Fans
If you need a quick way to explain expected goals in a single sentence, use this: xG is the probability that a soccer shot becomes a goal, based on the same kind of tracking data that tells basketball fans how open a shooter really was.
Once the comparison clicks, everything else follows. Shot selection matters. Defensive pressure matters. Luck is visible in the gap between actual goals and expected goals. A basketball-first fan who understands why a contested mid-range jumper is a bad shot already understands the most important lesson of expected goals: quality of chance matters more than the outcome.
In short, expected goals is not a mysterious football invention. It is a tracking-data-driven translation of shot quality. Basketball fans already spent years learning that a triple from the wing is not the same as a floater in traffic. Hand them xG and they will quickly see the same beautiful logic on a football pitch.