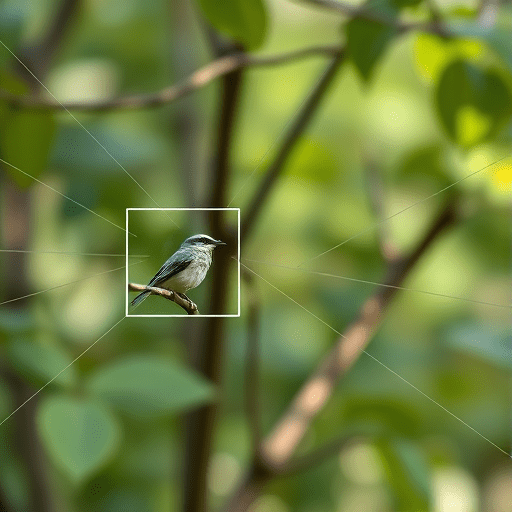
If you have been wondering how to use AI bird counts to validate carbon offset projects, you are in the right place. Carbon markets are pushing beyond simple tree-planting metrics, and biodiversity co-benefits are quickly becoming a non-negotiable part of verification. Birds are excellent indicators of ecosystem health, but counting them across large, remote project sites is expensive and slow. Open-source computer vision has changed that. With a laptop and a few free tools, you can build a bird counter that turns trail camera images into defensible data for carbon project reporting. This tutorial walks through the entire pipeline, from choosing models to interpreting results, without requiring a deep machine learning background.
Why Bird Counts Matter for Carbon Project Verification
Carbon offset projects often rely on reforestation, wetland restoration, or improved land management. These activities store carbon, but they should also support wildlife. Accurate bird counts give verifiers and investors a visible, measurable sign that the ecosystem is actually recovering. Birds respond quickly to changes in habitat structure, food availability, and disturbance, making them a sensitive early indicator.
Manual bird surveys require trained ornithologists, months of fieldwork, and careful standardization. They are also hard to scale. A single camera trap can capture thousands of images, and reviewing them by eye is tedious. This is where computer vision comes in. An open-source object detection model can automatically identify birds in those images, giving you counts and timestamps that create a repeatable monitoring workflow.
Choosing Open-Source Tools for Bird Detection
You do not need proprietary software or a research-grade GPU to start. Several open-source computer vision libraries have mature object detection support. For this tutorial, we will use YOLOv8 (You Only Look Once version 8) via the Ultralytics package, along with Open-CV for image handling and Google Colab as a free cloud environment. YOLOv8 is fast, accurate, and has a simple Python API.
You can use a pre-trained YOLOv8 model that recognizes many generic object classes, but for better precision on birds, you can fine-tune it on a public bird dataset from platforms like Roboflow Universe or the iNaturalist data archive. If you want a zero-training approach, you can also start with a fine-tuned bird detection model already hosted on Hugging Face, but downloading and running YOLOv8 locally gives you more control and is easier to integrate into a batch pipeline.
Step-by-Step: Building a Simple Bird Counter
This workflow assumes you have some familiarity with Python but are not yet an expert. If you get stuck, every step can be adapted to run in a Colab notebook with a few clicks.
Step 1: Collect and Prepare Your Images
Gather images from trail cameras or wildlife cameras set up across the carbon project site. Store them in a folder with a naming convention that includes the site ID and date, for example: site_A_2026-05-01.jpg. For a beginner project, start with 200–500 images. The model only needs to detect birds, not classify species, so even low-resolution images can work.
Before processing, resize all images to a uniform maximum width of 1280 pixels. This helps the detection model run faster while preserving accuracy. You can use a simple Python script with Open-CV to loop through your folder.
Step 2: Run a Pre-Trained Detection Model
Install the needed libraries in your Python environment:
pip install ultralytics opencv-python-headlessThen load the model and run inference on a single image:
from ultralytics import YOLO
import cv2

model = YOLO("yolov8m.pt")  # medium version, good balance
image = cv2.imread("site_A_2026-05-01.jpg")
results = model(image, conf=0.3)
print(results[0].boxes)
The output includes bounding boxes, class labels, and confidence scores. In the pre-trained COCO model, birds are class 14. That means you can filter to only bird detections.
Step 3: Filter and Count Birds in Python
The generic model may detect other animals and objects, so you need to isolate bird detections. Write a loop that processes every image, counts the number of boxes classified as bird, and appends the result to a CSV file.
import csv
import os
from ultralytics import YOLO

model = YOLO("yolov8m.pt")
bird_class = 14

with open("bird_counts.csv", "w", newline="") as f:
    writer = csv.writer(f)
    writer.writerow(["image", "bird_count"])

    for img_name in os.listdir("images"):
        img_path = os.path.join("images", img_name)
        results = model(img_path, conf=0.3)[0]
        bird_count = sum(1 for box in results.boxes if int(box.cls[0]) == bird_class)
        writer.writerow([img_name, bird_count])
For better accuracy, you can average counts over multiple images taken at the same location and time period. This reduces the risk of the same bird appearing in consecutive camera frames.
Relating Bird Counts to Carbon Project Validation
A CSV of counts is not enough on its own. You need to compare bird activity between the carbon project site and a control site, or compare the same site before and after restoration.
- Calculate average birds per image for each site and time window. This gives you a simple occupancy index.
- Use a basic detection rate: number of images with at least one bird divided by total images. This is useful if your images are mostly empty.
- Track seasonal trends by grouping counts by month. Birds are migratory, so a single snapshot can be misleading.
If you see significantly higher bird detection rates on restored plots than on degraded controls, that is meaningful evidence for a biodiversity co-benefit. You can include these summary statistics in a carbon project monitoring report alongside your carbon stock measurements.
Limitations and Ethical Considerations
Open-source computer vision is a powerful aid, but it is not a replacement for scientific rigor. Detection models can miss small or camouflaged birds, and false positives do happen. Always validate your automated counts against a small set of manually reviewed images. Aim for at least a 5% human-checked sample to estimate error and correct your totals.
Think about the context of your monitoring. Camera placement, light conditions, and vegetation density all affect detection. A forest site with thick understory will naturally produce lower counts than an open grassland, even if bird density is similar. Use consistent camera settings and positions across sites to keep comparisons fair.
Also be mindful of wildlife disturbance. Do not place cameras too close to nests or use bright flash settings that could disorient birds. Work with local conservation guidelines and, if necessary, get permits for any equipment installed in protected areas. AI monitoring should support conservation, not undermine it.
Beyond Image Detection: What Comes Next
This beginner workflow can quickly evolve. You can fine-tune YOLOv8 on species-specific bird datasets to generate species richness metrics, which are even more valuable for ecological assessment. You can also combine image counts with audio data from open-source tools like BirdNET to capture nocturnal or hidden species.
For larger carbon projects, you can deploy the model on edge devices or Raspberry Pi units with camera modules, running inference directly in the field. This reduces the need to upload thousands of photos and allows near-real-time monitoring.
Right now, the bottleneck is no longer access to machine learning tools. It is the ability to turn raw detection counts into standardized, meaningful ecological indicators. By learning this simple pipeline, you are contributing to a more transparent, data-driven carbon market that holds both carbon and biodiversity outcomes to the same high standard.
Use AI bird counts to validate carbon offset projects at any scale, and you will find that open-source computer vision turns an intimidating problem into a manageable script. Start small, validate your results, and let the birds speak for your project’s health.