If your Unreal Engine 5 iteration cycle has started to feel sluggish, the culprit is often not the editor itself but the asset pipeline feeding it. Designers waiting on shader recompiles, programmers losing seconds every time they PIE, and artists watching textures re-cook for no obvious reason are all classic symptoms of a quietly underperforming content pipeline. The good news for 2026 is that UE5’s cook-on-the-fly telemetry now offers enough granular data to pinpoint exactly where those seconds are being lost, without you having to guess or rely on tribal knowledge.
This walkthrough shows how to read that telemetry, what the most common pipeline bottlenecks actually look like in the logs, and the small structural changes that consistently restore fast iteration on real projects.
The Hidden Cost of “Just One More Cook”
Every studio eventually develops a folklore around iteration speed. Someone always says the editor “feels slow today” or that builds “seem heavier this week.” What is actually happening is that the asset pipeline, especially the DDC (Derived Data Cache) layer and the on-demand cooker, has started doing more work per edit than it should.
The real cost is not the obvious long cook. It is the cumulative cost of dozens of small hitches that each steal half a second to three seconds, hundreds of times a day. Over a week, those silent hitches can erase hours of productive work.
Symptoms that point to pipeline, not CPU
- Editor hitches only happen after saving specific assets, not on a schedule
- PIE start time grows linearly with project size rather than with code changes
- Shader compile spikes appear even on tiny material edits
- Cook-on-the-fly builds for client targets stall on the same packages repeatedly
When two or more of these match your daily experience, the pipeline is almost certainly the bottleneck, and the telemetry will confirm it.
Turning On Cook-on-the-Fly Telemetry in UE5
UE5 has steadily improved its diagnostic surface for the asset pipeline. For 2026-era projects, the most useful single switch is enabling detailed cook-on-the-fly and DDC logging through console variables and ini flags.
Start with these in your DefaultEngine.ini under [/Script/UnrealEd.EditorEngine] and [CoreRedirects]:
CookOnTheFly.EnableCookOnTheFly=TrueDDC.MaximumAsyncReadsPerFile=8(tune to your storage)LogShaderCompilers=LogLogDerivedDataCache=Verbose(use temporarily to capture hits and misses)
For runtime trace capture, add -trace=cpu,loadtime,file to your editor command line, then open the resulting .utrace file in Unreal Insights. The cook and DDC lanes are explicitly tagged, so you can filter directly to the pipeline without wading through unrelated subsystem noise.
What to actually look at in the trace
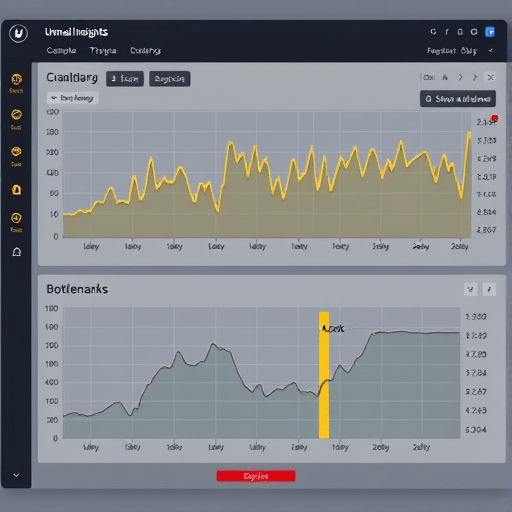
Open Insights, navigate to the Cook and Asset Loading tracks, and sort by duration. Three patterns show up repeatedly on struggling projects:
- Synchronous shader compiles blocking PIE. The trace shows a long, isolated gap between
BeginPlayand the first frame, owned by the shader compiler. - DDC misses on hot assets. The same texture or mesh is rebuilt on every editor launch because its cache key changed.
- Cook-on-the-fly requests waiting on a single worker thread. The cook graph fans out, but one serialized bottleneck dominates total time.
Reading the Logs Like a Diagnostic, Not a Postmortem
Most teams only read cook logs after a build fails. In practice, the same logs are far more valuable during normal iteration, because they reveal pipeline cost that never shows up as an error. Three log families are especially revealing.
1. DDC hit and miss patterns
With LogDerivedDataCache set to Verbose, you can see which assets are missing the cache and why. A healthy pipeline shows high hit ratios for everything except genuinely new assets. If you see repeated misses on the same files across sessions, your cache keys are unstable, often because of non-deterministic asset properties, plugin versioning, or editor-only data leaking into cooked output.
2. Package dependency chatter
Cook-on-the-fly logs list which packages each asset pulls in. When a single material edit triggers dozens of dependent packages, you are looking at over-coupling. The fix is rarely the material; it is the dependency graph around it. Splitting heavy references into smaller, purpose-built assets almost always shortens the cook request fan-out.
3. Shader compile queues
Shader compile time is the single most common cause of “mysterious” editor hitching. The pipeline logs will show queue depth, compile source, and which material triggered each compile. If your queue depth regularly reaches into the hundreds during a simple map open, your material variants are exploding combinatorially.
Three Structural Fixes That Restore Fast Iteration
Once the telemetry shows you where the time goes, the actual fixes tend to be structural rather than magical. These three are the highest-impact changes teams can make in 2026.
Stabilize your DDC keys
Make every cook-on-the-fly input deterministic. Strip editor-only metadata from cooked assets, pin plugin and engine versions in your build scripts, and avoid storing timestamps or random IDs in asset properties. The goal is that an asset’s cache key depends only on the data that affects the cooked output.
Break up monolithic dependencies
Look at the cook-on-the-fly log lines showing packages pulled in by indirect references. If a single UI texture drags in half of your gameplay data, the asset graph is doing too much work per change. Reorganizing data into focused, loosely coupled subsystems typically cuts per-edit cook fan-out dramatically, even before any code changes.
Tame material variant explosion
Materials with many static switches, quality branches, or texture parameters generate large shader permutation sets. Audit these with the material stats panel and collapse redundant variants. Where possible, replace branched logic with shared parent materials and instanced overrides. Fewer permutations means shorter shader compile queues and faster PIE start.
Building a Habit, Not a One-Off Audit
The mistake teams make after a successful diagnostic is treating it as a cleanup project. In reality, the asset pipeline drifts every week as new content lands, so a small, consistent monitoring habit pays off far more than a single deep dive.
Set up a short weekly review that compares the previous week’s Insights traces on a representative map open and a representative PIE start. Watch for:
- Sudden spikes in cook-on-the-fly request count after content drops
- New DDC miss patterns tied to a recent plugin or engine update
- Shader queue depth trending upward over multiple weeks
If any of these drift, you can intervene before iteration speed quietly erodes again. The telemetry exists precisely so this kind of regression does not become folklore.
Conclusion
Iteration speed in UE5 is a pipeline problem long before it is a hardware problem. With cook-on-the-fly telemetry and a few well-placed log settings, you can move from guessing about editor slowdowns to measuring them precisely. Stabilize DDC keys, simplify dependency graphs, and keep material variants in check, and the editor feels fast again, not because you upgraded your machine, but because the pipeline stopped doing wasted work it never needed to do in the first place.