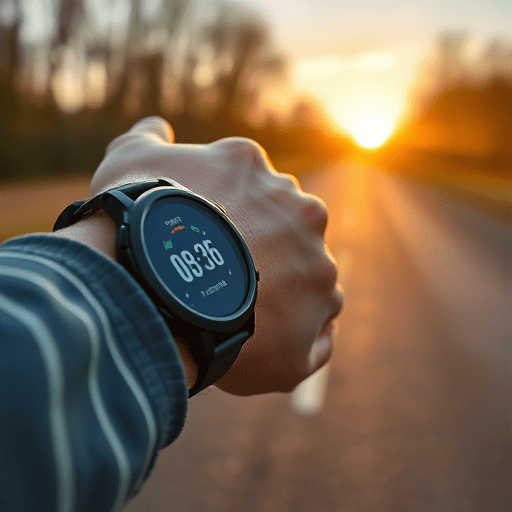
Modern basketball analytics has moved far beyond points, rebounds, and assists. Today, NBA teams rely on wearable technology to track NBA player load, capturing biometric and biomechanical data during practices, games, and even sleep. This shift is transforming how coaches manage minutes, how trainers prevent soft-tissue injuries, and how front offices evaluate the long-term durability of their roster. For fans and analysts alike, understanding this layer of data offers a richer picture of what really happens on the hardwood.
Why Box Scores No Longer Tell the Whole Story
The traditional box score has been the lingua franca of basketball since the sport’s earliest days, but it has always been incomplete. It tells you who scored and how many minutes they played, yet it says nothing about the cumulative stress a player’s body absorbed. A veteran point guard might log 28 minutes and produce a modest 12 points, while quietly absorbing enormous physical demand through repeated accelerations, defensive rotations, and pick-and-roll pursuits. Another player might score 22 points in the same window with far less structural strain on joints and tendons.
Wearables fill that gap by quantifying the invisible workload behind the visible production. Teams now measure external load (distance covered, sprint count, impacts) and internal load (heart-rate response, perceived exertion, muscle activity) in ways that were unimaginable a decade ago. This data, layered onto the box score, gives a more honest account of what a player’s body actually experienced.
The Core Metrics Behind Player Load Tracking
While every organization guards its exact formulas, several categories of metrics have become standard across the league.
Acceleration and Deceleration Bursts
Coaches and sports scientists pay close attention to the number of high-intensity accelerations and decelerations a player performs. These abrupt changes in velocity place significant stress on the hamstrings, calves, and groin. A player who makes 70 such bursts in a game carries a very different injury risk profile than one who makes 35, even if their total minutes are identical.
Jumping and Landing Load
Vertical jump count, jump height, and landing force are tracked to monitor knee and ankle stress. Centers and rim-running big men accumulate enormous lower-body load through repeated jumps for rebounds, rim contests, and lob finishes. Smart teams flag players whose jump totals spike above their seasonal baseline, often resting them proactively before soft-tissue warning signs appear.
Heart Rate Variability and Recovery
Heart rate variability (HRV) has become one of the most studied recovery indicators in professional sports. A suppressed HRV reading can flag accumulated fatigue or the early stages of illness before a player feels symptoms. By integrating HRV trends with on-court load, training staffs can adjust the next day’s practice intensity or recommend targeted recovery protocols.
Sleep and Circadian Data
Several franchises now provide players with sleep-tracking rings or bedside sensors. Quality sleep is one of the strongest predictors of next-day performance and injury resilience. Coaches have grown more comfortable adjusting shoot-around times and travel schedules based on objective sleep data rather than guesswork.
From Data Collection to Daily Decisions
Collecting the numbers is only the first step. The competitive edge comes from how staff members act on them. Strength and conditioning coaches now begin each morning by reviewing dashboards that combine the previous day’s training load, overnight HRV, and self-reported wellness scores. A player whose metrics drift outside their personal range may receive a modified practice plan, an extra recovery session, or in some cases, a planned off-day.
Head coaches receive summaries in language that translates cleanly to game planning. A report might state that a starter absorbed a season-high lateral load against a switch-heavy opponent and is a moderate injury risk for the second leg of a back-to-back. That kind of insight shapes rotation decisions, particularly during the dense 82-game grind or a deep playoff run.
Game-Day Applications and In-Match Adjustments
During games, bench coaches and analytics staff monitor real-time load metrics on tablets. If a star player’s external load approaches thresholds associated with elevated soft-tissue injury risk, the team can preemptively substitute before fatigue-related injuries occur. This kind of substitution is often invisible to viewers at home, yet it reflects a deliberate strategy rather than a reactive one.
Defensive schemes also benefit. By reviewing load data after games, teams can identify which assignments generated the most demanding movements for a defender. A perimeter player chasing screens all night accumulates a different load profile than one fighting through post-ups. Preparing the body for those demands in practice becomes more precise when those demands can be quantified.
Injury Prevention as the Primary Goal
Hamstring strains, calf injuries, and ACL tears are the league’s most feared non-contact issues, and they rarely arrive without warning. Wearable-informed workload management has become one of the most effective tools for reducing their frequency. Studies across multiple professional leagues have shown that teams using structured load monitoring see measurable reductions in soft-tissue injuries compared to those relying solely on minutes played.
For multi-year contracts worth tens or hundreds of millions of dollars, protecting a player’s availability is also a financial imperative. Front offices increasingly view load data as a contract-protection tool, helping stars reach the postseason healthy rather than fading in March after a punishing November.
What Fans Can Learn From the Wearable Revolution
For the average viewer, much of this data remains hidden behind team walls. However, broadcasts and league partners have begun surfacing simple indicators such as player speed and distance covered. As fans grow more familiar with these numbers, traditional debates about effort and toughness are being reframed in measurable terms.
Understanding that two players with identical box-score lines can leave the arena with very different physical tolls adds a fascinating dimension to watching the game. It also explains why a healthy reserve who logs 14 efficient minutes is sometimes more valuable than a starter fighting through accumulated fatigue.
Conclusion
Wearables have quietly become one of the most influential tools in the modern NBA, reshaping how player health is monitored, how rotations are constructed, and how careers are extended. The box score still tells us what happened, but the data gathered from sensors, straps, and rings reveals what it cost. As the technology continues to evolve, the teams that interpret that information most intelligently will hold a meaningful advantage in keeping their best players on the floor when it matters most.