# Fix Twitch Drop-Off: Using VOD Retention Graphs to Rebuild Your Stream’s Watch Time
Every Twitch streamer knows the feeling: you start with a solid viewer count, and then, like sand through an hourglass, the numbers slip away before you even reach the first game highlight. The data to fix this isn’t hidden in a third-party dashboard or a mystical algorithm — it’s sitting in your own Video on Demand (VOD) retention graph. This graph is the most underused tool in a streamer’s analytics kit, and it directly shows you the exact second a viewer decides to click away. If you want to reduce Twitch drop-off and boost watch time, stop guessing and start letting your VOD retention curve tell you where your stream loses momentum.
## Reading the VOD Retention Curve: Where Exactly Do Viewers Leave?
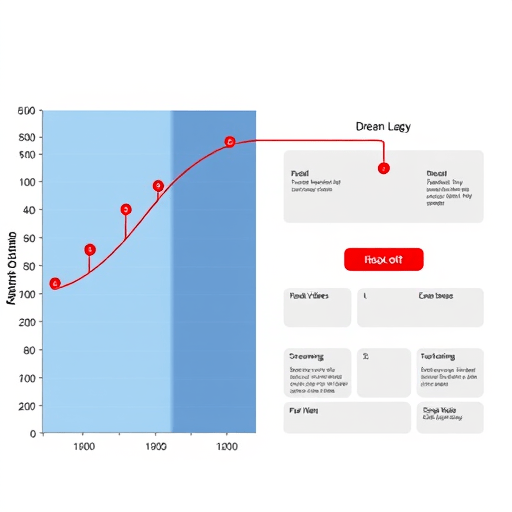
The VOD retention graph looks like a jagged mountain range. It plots the percentage of viewers still watching against the timeline of your stream. The first major cliff is almost always in the first minute. After that, smaller peaks and valleys show where your content kept people engaged or pushed them away. A sudden vertical drop usually corresponds to a specific event: a slow loading screen, a long silence, a rules overlay, or a transition between games.
Don’t just look at the overall shape. Zoom into the first five minutes. That’s where the steepest decline happens on most streams. But the real gold is in the mid-stream drops. If you see a repeated dip at, say, the 45-minute mark on every VOD, you have a structural pacing issue, not a content problem. Maybe that’s when you normally check alerts, read chat, or run a filler segment. The retention graph won’t tell you *why* people left, but it will tell you *when*. Your job is to cross-reference the graph with your own stream timeline and figure out what you were doing at that exact moment.
## Identify Your Drop-Off Spikes: The 30-Second Rule
One of the most common patterns in Twitch retention data is the “double dip.” The first dip happens in the first 30 seconds; the second happens around the first commercial break or mid-stream pause. For the first dip, the cause is almost always a weak hook. Viewers who click into your stream from the directory need to see and hear something compelling within half a minute. That doesn’t mean you need a flashy alert or a screaming intro. It means you need to be doing something — talking, reacting, explaining, playing — with energy that matches your intent.
Pull up your last five VODs and look at the first 30 seconds. Did you greet the stream with a drawn-out “Hello… thanks for stopping by… let me just check the stream health”? That’s a retention killer. Instead, structure your opening as a cold open: start mid-action, give immediate context, and acknowledge new viewers with a quick directional line like “If you’re new, we’re just about to attempt the boss fight.” Then use the retention graph to see if the curve flattens after that change. Track the percentage of viewers who make it past the 1-minute mark — that’s your “hook retention rate.” A small improvement here creates a compounding effect for the rest of the stream.
## Restructure Hook Points: Turn Early Exits into Sticky Segments
Once you’ve identified the exact drop-off spikes, it’s time to restructure your hook points. A hook point isn’t just the intro. It’s any moment where you intentionally re-engage the viewer to reset their attention. For example, if your retention graph shows a sharp decline at the 15-minute mark, that’s when you likely finished a match or a task and went silent while queuing. Instead of letting that dead air happen, insert a micro-segment: a quick chat poll, a funny clip review, or a 60-second rundown of your strategy for the next match.
Think of your stream as a series of mini-arcs, each with its own hook. The goal is to create “retention anchors” every 5 to 7 minutes. These can be as simple as raising your voice, standing up, switching camera angles, or saying “okay, this next part is important.” The VOD graph will show you if these anchors work. If you see a small uptick or a flattened curve right after you introduce a hook, you know you’ve found a structure that holds attention. If you see another cliff, try moving the hook earlier in the segment.
### Use the Peaks to Find Your Best Content
The opposite of a drop-off spike is a retention peak — a moment where your viewer count actually grows or holds steady against the overall trend. These peaks are your “signature moments.” Maybe they happen when you do an accent, when you start a boss fight, or when you tell a story. You need to identify these peaks in your VOD data and then deliberately engineer more of them. If the graph shows that chat interaction spikes your retention, then structure your segments to include a question or a poll every few minutes. If the graph shows that pure gameplay with no talky bits holds viewers, then trim your commentary segments.
## Segment Format: Pacing Your Stream for 2026 Viewers
The way viewers consume Twitch content has changed. They’re multitasking, watching with half an eye, and they have zero patience for filler. In 2026, the successful streamers are those who treat each broadcast like an episodic show. That means segmenting your stream into distinct blocks with clear labels and transitions. But not just any segmentation — you need to match your segment length to your retention graph. If your graph shows that the second hour always dips lower than the first, that’s a signal to change the format. Maybe you’re keeping the same game for too long, or maybe you’re playing a grindy game that loses visual interest.
Consider a rotated segment model: 25 minutes of intense gameplay, 5 minutes of chat/ talkie time, 10 minutes of a creative or interactive segment, then back to gameplay. The key is that each segment must have a self-contained structure: a mini-goal, a climax, and a quick payoff. This way, even if a viewer joins in the middle of a segment, they immediately understand what’s happening and what the next beat will be. Use your VOD retention graph to test different segment lengths. Compare the retention curve of a stream where you ran 60-minute blocks vs. a stream with shorter 20-minute blocks. The data will show which format keeps the average watch duration higher.
### Transitions Are More Important Than You Think
Transitions between segments are the exact places where retention graphs often drop. If you fade to black, pull up a browser window, or say “one second while I load this up,” you’re inviting viewers to leave. Treat every transition as a mini-hook. Announce what’s coming next with curiosity, and make the transition itself a part of the entertainment. For example, instead of a “be right back” screen, use a 10-second timer with a countdown and a fast-paced meme sound. Or, play a short interactive game with chat during the load time. The VOD graph will tell you if your transitions are effective: if you see a sudden dip right at the 20:00 timestamp, that’s a weak transition. Fix it by making the transition a “commercial break” for your own content — show a highlight clip from earlier in the stream, or put up a “Top 3 moments so far” list.
## From Insights to Action: A Simple Retention Audit Workflow
Stop treating your VOD retention graph as a post-stream afterthought. Make it part of your regular improvement cycle. Here’s a simple workflow you can run after every stream:
1. Open the VOD and jump to the retention graph. Skim the entire curve looking for cliffs and spikes.
2. Note the exact timestamps of the three biggest drop-offs.
3. Watch those 60-second windows in the VOD. Write down what you were doing, saying, and showing.
4. Now identify the three biggest peaks. Watch those windows and note what happened that kept viewers engaged.
5. Write one concrete change for the next stream: for each drop-off, design a new hook or transition; for each peak, plan to repeat that type of content earlier or more often.
6. Repeat the audit after the next stream to see if the changes impacted the curve.
This audit doesn’t take more than 30 minutes, and it’s far more valuable than reading generic advice about “being more entertaining.” You’re using your own audience’s behavior to guide your decisions. Over time, you’ll build a mental model of what your specific community responds to. You’ll also improve your average watch time, which influences Twitch’s recommendation algorithm and your directory rank.
## Conclusion
VOD retention graphs transform vague anxiety about viewer drop-off into a precise, actionable map. By reading the curve, you can spot the exact moments that cause viewers to leave, identify the content that keeps them around, and restructure your hooks and segment format accordingly. This is not about copying what other streamers do; it’s about learning from your own data to craft a streaming experience that holds attention naturally. The next time you finish a broadcast, don’t just close the tab. Open that retention graph, find the cliffs, and start rebuilding your stream from the moments that matter.