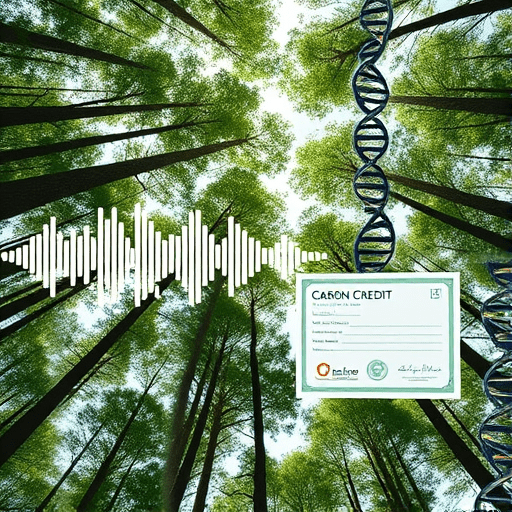
Biodiversity credit markets crossed a maturity threshold in 2026. Buyers, registries, and insurers no longer accept a spreadsheet of expert observations; they demand verifiable, time-stamped, and independently reviewable evidence. That shift makes this biodiversity tech buyer’s guide for carbon project developers essential reading before signing any procurement contract. The goal is not to rank every product on the market, but to help you understand how the three dominant monitoring families — eDNA, acoustic sensors, and satellite remote sensing — fit into a credible biodiversity verification strategy that withstands auditor scrutiny.
Why Verification Now Defines Project Value
Voluntary carbon markets have effectively merged with biodiversity credit markets. A carbon project that cannot demonstrate positive biodiversity outcomes risks losing its insurance, its premium pricing, and even its registration status. Meanwhile, standards bodies are tightening methodology requirements, and the first “biodiversity credit rating” agencies have begun publishing comparative quality scores. In this context, monitoring, reporting, and verification (MRV) technology is no longer a back-office compliance function — it is the product.
For developers, this creates a new discipline: technology procurement shaped by ecological credibility. The vendors who thrive in 2026 are not those with the flashiest dashboards, but those whose data pipelines can be interrogated, reproduced, and integrated into carbon accounting workflows. The tools you choose today will determine whether your credits remain bankable after third-party audits and, increasingly, after litigation challenges.
Comparing the Three Core Verification Technologies
Each monitoring family answers a different ecological question with a different resolution, latency, and cost structure. A smart buyer understands where each tool is strong, where it fails, and what a realistic budget should be.
eDNA: The Precision Microscope
Environmental DNA (eDNA) analysis detects genetic traces that organisms leave behind in water, soil, or even air. One filtered water sample can reveal dozens of fish species, amphibians, or invertebrates without a single visual sighting. For carbon project developers, the power of eDNA lies in its specificity: auditors can trace a species claim to a validated laboratory report and a genetic sequence reference.
- Strengths: Species-level identification, detection of cryptic or nocturnal species, strong audit trail when paired with chain-of-custody protocols.
- Limitations: Point-in-time snapshots, laboratory turnaround delays, per-sample costs that scale quickly across landscapes.
- Best use cases: Baseline biodiversity surveys, threatened species monitoring, aquatic ecosystems, and post-restoration species recolonization checks.
When evaluating eDNA vendors, ask whether they maintain their own reference databases or rely on public repositories. Proprietary databases can bias results in favor of species the company has invested in sequencing. A credible vendor openly discloses database coverage and detection limits per species.
Acoustic Monitoring: The Continuous Ear
Acoustic monitoring deploys solar-powered or battery-operated audio recorders across a project area, capturing soundscapes over weeks or months. Machine learning models then identify bird calls, bat echolocation, amphibian choruses, and even insect buzzes. The major advantage is temporal coverage: acoustic tools detect variability and seasonality that eDNA and satellite imagery completely miss.
- Strengths: 24/7 data collection, relatively low cost per data point, ability to detect rare vocal species, poaching and illegal logging detection.
- Limitations: Data volume can overwhelm teams; model accuracy is regionally dependent; weather and wind noise degrade recordings.
- Best use cases: Forest restoration projects, bird and bat community assessments, and threat monitoring in remote areas.
Acoustic vendors differ by what ecosystems their models support. If your project is in the tropics, a model trained on North American bird song will produce unusable results. Insist on models pre-trained on your biome, and request confusion matrices showing false positive and false negative rates for indicator species.
Satellite Remote Sensing: The Macro Eye
Satellite imagery and aerial surveys remain the only tools capable of covering thousands of hectares in one pass. Sentinel-2 and similar open-source platforms provide free multispectral data, while commercial providers offer sub-meter resolution and synthetic aperture radar (SAR) that penetrates cloud cover. Satellite data tracks habitat structure, deforestation risk, fire scars, and vegetation productivity — essential metrics for carbon accounting and leakage monitoring.
- Strengths: Landscape-scale coverage, standardized repeated observations, strong alignment with carbon stock estimation methodologies.
- Limitations: Indirect species inference, spectral confusion between vegetation types, cloud interference in equatorial zones, and high costs for the most precise commercial images.
- Best use cases: Habitat integrity metrics, deforestation alerts, restoration progress tracking, and buffer zone leakage analysis.
Beware of any satellite provider that claims direct species detection. At 30-meter resolution, nobody is seeing a pangolin. The real value is contextual: satellite data proves the habitat exists, remained intact, or regrew in a target area, which supports the underlying assumptions of species recovery.
A Sharp Buyer’s Checklist for Biodiversity Verification Tools
Comparing vendors purely on headline accuracy percentage is a trap. Use this checklist to standardize evaluations across eDNA, acoustic, and satellite offers.
- Methodology alignment: Does the tool produce data compatible with your chosen credit standard — such as Verra, Plan Vivo, or the emerging Biodiversity Credits Alliance framework?
- Ground-truth proof: Has the vendor published peer-reviewed or independently audited validation of performance in your ecosystem type?
- AI transparency: Are classification models explainable? Can you export raw model outputs, confidence scores, and training data provenance?
- Raw data access: Does the license let you download the underlying audio files, genetic sequence reads, or satellite scenes — or are you locked into a vendor dashboard?
- Integration readiness: Does the platform offer an API or common data format for ingestion into your existing MRV system?
- Cost per delivered outcome: Compare cost per verified species observation, cost per hectare of covered acoustic coverage, and cost per deforested-hectare detection, not hardware unit price.
- Hardware longevity: In tropical projects, field sensors survive only a few seasons. What is the vendor’s replacement policy and uptime guarantee?
This checklist prevents a common failure: buying technology that produces beautiful visualizations but cannot feed the exact evidence formats that your auditor expects.
Layer, Don’t Tolerate: The Stacked Verification Approach
A shared purchase mistake is treating the three technologies as competitors. In practice, the strongest 2026 projects stack them into a layered verification architecture where each tool’s weaknesses are covered by another’s strengths.
Consider a 5,000-hectare tropical forest restoration project. Satellite imagery confirms habitat area and detects illegal encroachment at scale. Acoustic units across transects continuously monitor bird and mammal communities, providing a disturbance early warning. Quarterly eDNA sampling in streams and soil plots validates species-level presence and genetic diversity. The output is a multi-resolution evidence graph: satellite proves the habitat exists, acoustics prove it is active, and eDNA proves which species actually inhabit it.
When designing your stack, prioritize interoperability. Ask vendors for their data export schemas and whether they support third-party analysis. The most valuable partners are those willing to sign data-sharing agreements that preserve your ownership and grant you permanent access to raw observations. Avoid proprietary ecosystems that hold your sustainability data hostage.
Avoiding the Green-Dashboards Trap
One of the most common pitfalls in 2026 procurement is paying a premium for aesthetics. A polished interface that shows a wildlife recovery score derived from a black-box algorithm cannot be verified. Auditors increasingly reject tools that do not disclose their data lineage, and some market analysts have begun warning about “greenhushing” — projects that deliberately publish vague biodiversity metrics because their underlying sensor data is indefensible.
The solution is explicit data governance. Every species detection should trace back to a sample ID, a geo-tagged location, a timestamp, a model version, and a confidence threshold. Every habitat metric should reference a clear definition of the satellite index and a documented validation against field plots. If a vendor cannot provide this lineage, walk away — no matter how impressive their sales imagery looks.
Conclusion
Assembling the right verification stack is not about buying the most expensive instrument. The most credible projects in 2026 treat eDNA, acoustic, and satellite data as complementary inputs within a transparent, defensible system supported by clear metadata, reproducible AI, and independent ground-truthing. By applying the comparison framework in this buyer’s guide, carbon project developers can move past marketing hype and invest in verification tools that satisfy auditors, unlock credit premiums, and ultimately uphold the ecological claims that the entire market depends on.