Every coastal project manager knows the twin pressures of 2026: verification standards are tightening, and per-credit budgets are shrinking. That makes the choice between seagrass and mangrove tracking apps more than a technical decision — it’s a financial one. Tracking apps don’t just produce maps; they translate raw drone and satellite data into the biomass estimates, sediment carbon stocking factors, and change-detection reports required by carbon registries. But the same app and data pipeline behave very differently across the two ecosystems. Seagrass monitoring tends to benefit from simple water-column correction and low structural complexity, while mangrove monitoring rapidly escalates in data processing demands. Understanding where those costs diverge will save you thousands per monitoring cycle before you ever book a single field day.
Why the Underlying Ecosystem Sets Your Monitoring Budget
Blue carbon tracking apps are essentially advanced image classifiers plus geometry tools. Their cost efficiency depends on how well they can separate target vegetation from noise. Seagrass beds grow in relatively open, flat, submerged zones. Mangroves are dense, upright forests with overlapping canopies, pneumatophores, and intertidal mudbanks. That simple distinction drives everything: required resolution, revisit frequency, and AI training data.
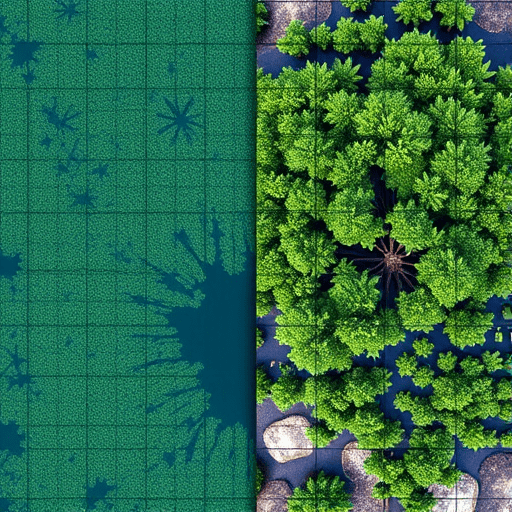
For seagrass, an app built around 3- to 10-meter satellite imagery can often deliver respectable areal coverage. The spectral signature of seagrass against bare sand is strong, especially in shallow, clear-water sites. For mangroves, the same resolution typically yields an unhelpful mush of green. Mangrove species discrimination, structural degradation, and standing biomass estimation need submeter resolution at minimum. That immediately pushes you from free Copernicus data to paid commercial constellations or local drone flights.
Habitats are also intrinsically dynamic. Mangrove loss from storm surges and shoreline erosion happens in thin linear strips. Seagrass die-offs often appear as patchy, darkening zones within a meadow. Detecting both requires monthly or quarterly observations, but the optimal sensor type and processing chain differ. Apps that oversimplify can one-size-fits-all and end up forcing you to pay for unusable deep-analysis layers.
Canopy Complexity vs. Underwater Optical Physics
Mangroves hide their carbon beneath dense canopies, so photogrammetry must produce accurate canopy height models — not just a flat NDVI map. That often means overlapping drone imagery, ground-control points, and lots of processing time. Seagrass, meanwhile, forces you to contend with water column reflectance, sun glint, and turbidity. But robust depth-correction protocols now exist and many apps can apply them automatically. The winner here for low-cost drone apps is seagrass: success criteria are simpler to code, so subscription prices stay lower.
Satellite Data: Cheap Base Layer or Expensive False Economy?
Low-cost tracking apps frequently advertise satellite data as the way to slash blue carbon monitoring budgets. That can be true for seagrass. Open-access missions like Sentinel-2 (10-meter resolution) align well with typical seagrass patch sizes, and validated scientific algorithms convert reflectance to canopy cover with reasonable confidence. But the most budget-conscious managers need to look beyond the data price — analyze the hidden processing costs. Sentinel-2 captures a scene every five days, but cloud cover and sunglint often leave you with a single usable image per quarter. The app’s quality-assurance dashboard and automated gap-filling features decide if you can actually rely on that free imagery. If the app forces manual re-tagging or manual masking, labor costs balloon.
For mangroves, pure satellite tracking apps have a different problem: optical data saturates over tall, dense canopies. Sentinel-2 underestimates biomass in mature mangroves by as much as 40% in some regional studies. To correct that, apps now integrate spaceborne radar (as Sentinel-1) for structure. That adds a second data stream and more algorithm subscriptions. If your category is immediate budget constraints, you may prefer a mangrove tracking app with built-in synthetic aperture radar, even if it costs slightly more per hectare, because it avoids paying for a separate geospatial analysis platform.
Practical sector viewpoint: do not compare apps on data price alone. Compare the total cost of a credible carbon stock estimate. A pure optical seagrass app at USD 100 per site can be cheaper than a general satellite app that charges extra per layer. A mangrove app with automatic SAR fusion at USD 800 per site might still be cheaper than adding a subcontractor for the same analysis.
Drone-Based Tracking Apps: Where Marginal Costs Climb Fastest
Drone data are the gold standard for high-resolution verification, especially for methodologies that require direct canopy height or species-level identification. But anyone tracking blue carbon costs knows that drone operations are logistics-heavy. The flight itself is rarely the bottleneck; the app layer must handle mission planning, ground-control alignment, radiometric calibration, and mosaicking. Seagrass projects initially appear attractive — wide, flat meadows can be covered with long automated transects. However, those same projects face limited battery life and marine wind exposure. Mangrove drone work is nastier: dense prop-root tangles, steep muddy terrain, and heavy shadows make ground control placement painful.
Newer 2026 drone apps are capitalizing on edge AI to cut those costs. Onboard classification means you no longer need to upload thousands of raw 20-megapixel images to the cloud — a major relief for managers in low-bandwidth coastal regions. But beware: these apps often charge per flight hour or per processed polygon. A mangroves monoculture drone survey might process in 20 minutes, while a seagrass multi-species turf bed could take hours of expensive server time because of spectral similarity between algae and sea grass.
Processing Costs, Not Flight Costs, Are the Frontier
The cheapest drone is useless if the app cannot automatically convert orthomosaics into ecosystem-specific metrics. Look for features like seagrass-specific depth-invariant index (DII) and mangrove-specific volume-to-biomass allometrics. The moment you need manual model-fitting, your monitoring cost per scheduled report climbs past the satellite-only approach. For below-the-canopy biomass estimates, a three-year old study showed that combining drone canopy height with ground plots was the most cost-efficient — at roughly USD 45 per hectare. The same analysis using high-resolution commercial satellite imagery alone cost USD 130 per hectare due to more field validation plots.
Hybrid Workflows: The Real Cost Cutter for Both Habitats
The headline insight of late is that no single app — satellite-only or drone-only — consistently minimizes monthly spend. The most cost-effective strategies blend both: use freely available satellite data to stratify the site (low biomass vs. high biomass, healthy vs. stressed) and then deploy drone flights only on a representative subset of those identified zones. Apps that let you export a stratified sampling design directly into a drone flight controller are worth more than apps with beautiful but unconnected visual dashboards.
For seagrass, the integration reduces underwater ground-truthing requirements. Because the water column is more predictable, satellite classification of a large meadow can anchor the total area. Drone then focuses on critical validation strips near the meadow’s edge. In mangroves, the hybrid model shines in remote sensing both the upper canopy and the understory. Satellite SAR provides large-scale backscatter for biomass gradients; drone lidar or modern photogrammetry provides precise height calibration on 5-10% of plots.
Several startups in 2026 now price hybrid workflows per verified carbon tonne rather than per square kilometer. That flips the incentive: the app only gets paid when your methodology result satisfies the registry. For project managers who worry about upfront costs, this model removes the risk of paying for a huge monitoring dataset that later fails due to an offsetting methodology criterion.
Questions to Ask Before Choosing Either Tracking App Class
- What is the minimum mapping unit? Seagrass apps using medium-resolution satellites may ignore narrow patches below 0.1 hectares. Mangrove apps should detect fragmented fringe trees over tidal creeks.
- How does the app handle tidal state? For mangroves, an image captured at high tide hides prop roots and changes canopy height estimates. For seagrass, high tide can block all usable light. Automated tide filtering is a major cost saver — manual curation is slow.
- Are change-detection alerts actionable? A low-budget app may email you raw NDVI changes that generate dozens of false alarms. A better app uses habitat-specific disturbance models and only flags alerts for areas where carbon stock loss is plausible.
- What metadata are exported? Auditors in 2026 are increasingly demanding full uncertainty calculations and confidence intervals for every biomass pool. If an app exports only a final number, you will incur heavy costs assembling audit-grade evidence manually.
- Can you host your own processing? Some coastal project teams work in places with severe data sovereignty rules. Tracking apps with one-way cloud upload can become unusable. On-premise or edge deployment alters the cost-benefit drastically.
Practical Decision Matrix
For a rapid assessment of your own context, consider this rule of thumb. If your seagrass project is shallow, relatively clear, and beyond one kilometer from shore, a modern satellite-based tracking app will likely beat drone-based costs by a factor of three to five. If your mangrove site is a continuous, tall, intact forest, the same satellite app will underperform; spend the money on a drone-centric app with rigorous canopy height modeling. For degraded or fragmented mangroves and intertidal seagrass mosaics, a hybrid workflow is increasingly the only way to keep verification costs under 10% of carbon credit revenue.
The 2026 data ecosystem has also made rapid benchmarking easier. Several publishers now release open datasets by coastal project type, and savvy managers use those to simulate their expected cost per verified tonne under different apps before signing annual licenses. Do not just rely on sales demos. Ask a prospective app vendor to run a blind test on your most recent drone imagery or remotely sensed satellite scene. The cost of that trial nearly always reveals whether the app can meet your budget constraints.
Fifteen-Month Outlook for Monitoring Costs
The sharpest trend in the carbon market is the diverging cost curve between seagrass and mangrove monitoring as radar and AI advance. Satellite radar bands (L-band on new missions) are especially useful for mangroves, reducing the need for costly airborne data. Meanwhile, seagrass monitoring is benefiting from improved atmospheric correction and higher temporal revisit windows — which continues to compress costs. Do not choose and then forget. Every 12 to 15 months, re-quote your monitoring workflows; switching costs are low enough that persisting with a legacy app could quietly drain your project budget.
Focus on the output accuracy metric that matters to your registry. Both ecosystems have different dominant error terms. Seagrass error tends to come from spatial boundary uncertainty and mixed-pixel effects at edges. Mangrove error often comes from canopy height saturation and understory stock omission. The app that minimizes your specific error source — and thus needs fewer ground plots to meet precision requirements — is ultimately the one that lowers your real blue carbon cost.
The central takeaway is straightforward: seagrass tracking apps shine when they turn large, open-access satellite datasets into defensible maps, while mangrove tracking apps earn their keep through high-resolution structural sensing paid for on a smaller footprint. Rather than asking which is universally better, ask which makes your verification audits cheaper in your exact coastal condition. Measuring twice and choosing once has never been more important.