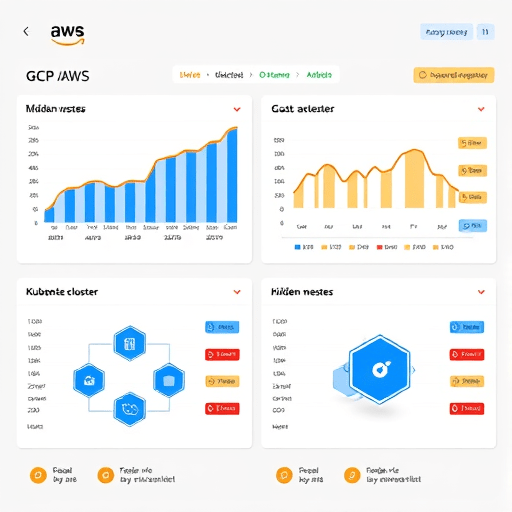
Running Kubernetes across both AWS EKS and GCP GKE promises flexibility, but it also creates a sprawling surface area where money quietly leaks. Idle node pools, over-provisioned persistent volumes, duplicated egress traffic, and forgotten load balancers can drain budgets faster than most engineering teams realize. This playbook walks FinOps engineers through a structured multi-cloud Kubernetes cost audit designed to surface the waste hiding in plain sight across EKS and GKE environments.
Why Multi-Cloud Kubernetes Spending Is Harder to Control
Single-cluster cost reviews are already tricky. Multi-cloud makes it worse because each provider uses different billing models, metrics namespaces, and pricing units. A vCPU-hour on EKS is not the same as a vCPU-hour on GKE once you factor in committed-use discounts, sustained-use discounts, and regional pricing tiers. Engineers often optimize for one provider’s metrics while ignoring the other, leaving asymmetric waste behind.
The first step of any audit is acknowledging that cost visibility per cluster, per namespace, and per business unit must be unified before optimization can begin.
The Three Layers Where Costs Hide
- Compute layer: node pools, spot versus on-demand mix, bin-packing efficiency
- Storage layer: orphaned PersistentVolumes, over-provisioned PVCs, snapshot sprawl
- Network layer: cross-region egress, NAT gateway charges, inter-cluster traffic
Phase 1: Establishing a Unified Cost Baseline
Before you can find waste, you need a single source of truth. Most teams rely on cloud-native tools like AWS Cost Explorer and GCP Cloud Billing, but these tools do not natively understand Kubernetes abstractions like namespaces, labels, or pod-to-pod traffic.
Adopt a Kubernetes-aware cost allocation tool that supports both providers. Open-source options like OpenCost or commercial platforms that ingest AWS Cost and Usage Reports (CUR) and GCP BigQuery billing exports are reasonable starting points. The goal is to map every dollar back to a namespace, deployment, or label.
Label Discipline Is Non-Negotiable
Audits stall immediately when labels are missing or inconsistent. Enforce a labeling policy that includes:
teamorcost-centerenvironment(prod, staging, dev)workload-type(batch, service, ml)business-unit
Anything unlabeled should be flagged as a cost anomaly and investigated within the same sprint.
Phase 2: Compute Waste Across EKS and GKE Node Pools
Compute usually represents 60 to 75 percent of Kubernetes spend, making it the highest-leverage area for an audit. The waste patterns below appear repeatedly across both providers.
1. Right-Sizing Requests and Limits
Many teams set CPU and memory requests based on guesswork during initial deployment and never revisit them. Use Vertical Pod Autoscaler recommendations in recommendation mode (not the live updater) to collect data over a two-week window. Compare requested versus actual usage and flag workloads where requests exceed actual peak usage by more than 30 percent.
2. Node Pool Fragmentation
EKS and GKE both encourage separate node pools for different instance families or purchase options. Over time, this leads to fragmentation where small workloads land on large nodes and leave headroom unused. Audit node pool utilization weekly. If average utilization across any pool drops below 40 percent, consider consolidating workloads into a smaller instance type or switching to a single mixed pool.
3. Spot, Preemptible, and Committed-Use Mismatches
On AWS, EC2 Spot Instances can cut compute costs by up to 70 percent for fault-tolerant workloads. On GCP, Spot VMs offer similar savings, though the interruption behavior differs. Meanwhile, AWS Savings Plans and GCP Committed Use Discounts (CUDs) work well for predictable baseline capacity.
The hidden cost in multi-cloud setups is mismatched commitment coverage. A common mistake is buying Savings Plans for AWS workloads that have already migrated to GCP, or vice versa. Reconcile your committed spend against actual steady-state usage on each provider every quarter.
4. Zombie Workloads in Non-Production
Staging and dev clusters often run 24/7 even when engineers are offline. Implement a scheduled scale-down policy: dev clusters off nights and weekends can save 60 to 70 percent of their compute cost with zero developer impact. Tools like KEDA or cluster autoscaler schedules make this straightforward.
Phase 3: Storage Waste That Rarely Shows Up in Dashboards
Persistent storage is the second-largest cost sink in Kubernetes, and it is far more invisible than compute.
Orphaned PersistentVolumes
When a StatefulSet or pod is deleted, its PVC often lingers. On AWS, this means an idle EBS volume continues to charge monthly. On GCP, it means a Persistent Disk sits unused. Run a script weekly that lists PVs with no corresponding running pod and flag any older than seven days for review.
Over-Provisioned PVCs
Unlike compute, storage cannot easily be shrunk in most cases, so teams over-provision during launch and never resize. Audit PVCs whose actual usage (visible through metrics like kubelet_volume_stats_used_bytes) is less than 25 percent of capacity. These are candidates for migration to a smaller volume class, especially on GCP where disk IOPS and throughput are tied to size.
Snapshot Sprawl
Volume snapshots are cheap to create and easy to forget. Both AWS EBS Snapshots and GCP Persistent Disk Snapshots accrue incremental charges that compound over months. Enforce a snapshot retention policy of 30 days for non-production and 90 days for production, with mandatory tagging.
Phase 4: Network Egress, the Silent Budget Killer
Network costs are the most underestimated line item in multi-cloud Kubernetes. The key insight is that cross-cloud and cross-region egress is dramatically more expensive than intra-region traffic.
Audit Cross-Region and Cross-Cloud Traffic
Use VPC flow logs on AWS and VPC Flow Logs or packet mirroring on GCP to map outbound destinations. Look for:
- Services in us-east-1 talking to GKE workloads in europe-west1 (cross-cloud egress at premium rates)
- Multi-region clusters replicating data unnecessarily
- Logging or telemetry agents sending data across regions
Even modest traffic at 5 TB per month between AWS and GCP can produce five-figure monthly bills.
NAT Gateway and Cloud NAT Waste
On AWS, NAT Gateway charges are based on hours and data processed. On GCP, Cloud NAT charges are based on data processed only. Idle NAT resources or NAT resources fronting only a few pods are a common hidden cost. Audit NAT gateway usage and consolidate where possible, or replace with NAT instances for low-traffic subnets.
Ingress and Load Balancer Sprawl
Every Kubernetes Ingress of type LoadBalancer provisions either an AWS ELB or a GCP Load Balancer. Forgotten test environments often leave these running after the workload is removed. Sweep for load balancers monthly and cross-reference against active Ingress resources.
Phase 5: Building the Remediation Workflow
Identifying waste is only half the job. FinOps teams need a repeatable workflow to act on findings without slowing down engineering.
Prioritize by Dollar Impact and Effort
Plot each finding on a 2×2 matrix of dollar impact versus remediation effort. Quick wins like deleting orphaned PVs and resizing non-production clusters go first. Larger initiatives like Savings Plan rebalancing or workload re-architecture get scheduled into quarterly planning.
Embed Cost Reviews in the SDLC
The most effective FinOps programs integrate cost reviews into existing engineering rituals. A short cost section in the design doc template, a pre-deployment cost estimate in CI, and a monthly cost review per service team all reduce future waste.
Set Cluster-Level Budgets and Alerts
Both AWS and GCP support budget alerts at the account or project level, but neither understands Kubernetes natively. Use your cost allocation tool to set per-namespace budgets with alerts at 80 percent and 100 percent of forecast. This converts cost data into something engineers actually see during incidents.
Phase 6: Sustaining Savings Long Term
A one-time audit can recover significant spend, but ongoing discipline is what keeps waste from returning. Schedule quarterly audits using this playbook, rotate the cluster owners who participate so institutional knowledge spreads, and publish anonymized findings internally to keep the conversation alive. As workloads evolve and new instance types launch on each provider, the waste patterns will shift, and the audit must shift with them.
Conclusion
Multi-cloud Kubernetes environments are powerful but financially opaque. By unifying cost allocation, enforcing label discipline, auditing compute and storage waste, and tracking network egress carefully, FinOps engineers can recover meaningful spend without touching application code. The patterns in this playbook are not exotic — they are the same waste hiding in most clusters — but treating them as a repeatable audit program rather than a one-off cleanup is what separates mature FinOps practices from reactive firefighting.