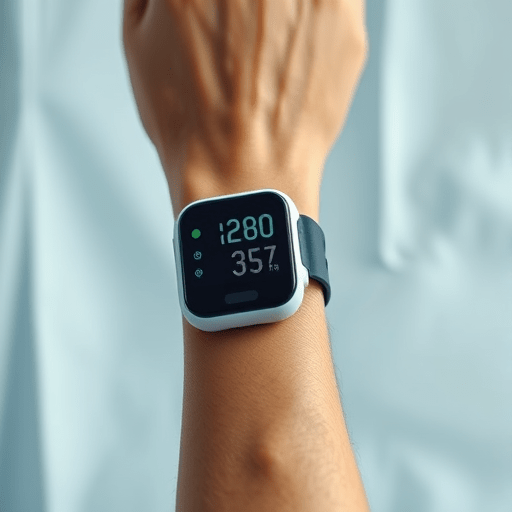
With wearable blood pressure monitors proliferating in both consumer markets and clinical research, the imperative to verify wearable BP monitor accuracy before clinical use has never been greater. Clinicians, researchers, and regulators must systematically validate a device against the clinic gold standard—the mercury sphygmomanometer or validated automated cuff—to guarantee reliable readings that inform patient care. This guide walks through the entire validation workflow, from study design to regulatory documentation, using the latest 2026 standards and best practices.
1. Define the Scope and Objectives
Before any testing begins, clarify the purpose of validation. Common objectives include:
- Confirming that the wearable’s systolic and diastolic readings fall within the acceptable tolerance (±5 mmHg) of the clinic standard.
- Assessing performance across diverse patient demographics (age, sex, BMI, skin tone).
- Evaluating device behavior during typical daily activities (walking, sitting, sleep).
- Generating documentation required for regulatory submission (e.g., FDA 510(k), CE Marking).
Documenting these goals early ensures that the subsequent protocol aligns with both clinical expectations and regulatory mandates.
2. Select the Reference Method
Regulatory guidelines stipulate that validation must use a validated reference method. In 2026, the preferred reference is a validated automated cuff or, where feasible, a mercury sphygmomanometer read by an experienced clinician. The reference device must:
- Be calibrated within the last 12 months.
- Have undergone ISO 81060‑2:2022 testing and received a Class I validation certificate.
- Provide simultaneous recordings that can be time‑stamped to align with the wearable data stream.
When using a consumer cuff as a reference, ensure it meets the same validation criteria to avoid introducing bias.
3. Design the Validation Study
Follow the ISO 81060‑2:2022 protocol, but adapt it for the wearable context. Key design elements include:
3.1 Participant Recruitment
Enroll at least 45 participants (minimum 33 per the ISO guideline, but 45 provides better statistical power) with a broad range of blood pressures: low (<90 mmHg), normal (90–140 mmHg), and high (>140 mmHg). Include:
- Adults aged 18–80.
- Both sexes.
- BMI categories (underweight, normal, overweight, obese).
- Skin tone diversity (Fitzpatrick scale I–VI).
3.2 Test Conditions
Conduct measurements in two environments:
- Resting State: Participants seated comfortably for 10 minutes before measurements.
- Ambulatory State: Participants wear the device during normal daily activities for 24 hours to capture motion artefacts.
3.3 Measurement Protocol
For each participant, perform the following sequence five times, with 1‑minute intervals:
- Record reference cuff measurement.
- Record wearable measurement (same arm).
- Allow 30 seconds of rest.
Each set yields a paired systolic and diastolic value for comparison. For ambulatory data, use software that automatically timestamps and aligns readings.
3.4 Data Quality Checks
Implement real‑time quality filters:
- Reject readings with motion artefacts exceeding 20 % of the signal amplitude.
- Flag cuff cuff inflation pressures outside the manufacturer’s recommended range.
- Cross‑validate participant’s heart rate with an ECG patch to confirm accurate pulse detection.
4. Data Analysis and Accuracy Metrics
After data collection, calculate the following:
4.1 Mean Difference and Standard Deviation
Compute the mean difference (wearable minus reference) for systolic and diastolic pressures, and their standard deviations. ISO 81060‑2 requires:
- Mean difference within ±5 mmHg.
- Standard deviation ≤8 mmHg.
4.2 Bland–Altman Plots
Create Bland–Altman plots for systolic and diastolic readings to visualize agreement and identify any proportional bias. Look for patterns where the wearable deviates more at higher or lower blood pressures.
4.3 Subgroup Analyses
Assess accuracy across subgroups:
- Age brackets (18‑40, 41‑65, 66‑80).
- BMI categories.
- Skin tone groups.
- Physical activity levels (sedentary vs. active).
Report any statistically significant differences (p < 0.05) and investigate root causes (e.g., sensor placement, signal‑to‑noise ratio).
5. Addressing and Mitigating Error Sources
Wearables can suffer from various error sources. Use the following mitigation strategies:
- Calibration Drift: Perform a pre‑study calibration against the reference cuff, then recalibrate weekly during the study.
- Motion Artefacts: Employ accelerometer data to flag high‑motion periods; consider using adaptive filtering algorithms.
- Signal Interference: Shield the wearable’s photoplethysmography (PPG) sensor from ambient light using a matte coating.
- Skin Tone Impact: Adjust sensor gain dynamically based on baseline reflectance to compensate for darker skin tones.
Document each mitigation step and its effect on the data quality.
6. Generate Validation Report and Regulatory File
Compile a comprehensive report including:
- Study protocol, inclusion/exclusion criteria, and participant demographics.
- Detailed methodology (reference device specs, wearable sensor details, data acquisition software).
- Raw data summaries, statistical analyses, and plots.
- Discussion of deviations, limitations, and corrective actions.
- Conclusion stating compliance with ISO 81060‑2:2022 and any regulatory standards.
Attach the report to the regulatory submission package (e.g., FDA 510(k) pre‑market notification, CE Technical File). Include evidence of post‑market surveillance plans to monitor ongoing accuracy.
7. Post‑Validation Monitoring and Continuous Improvement
Once deployed clinically, establish a feedback loop:
- Collect anonymized patient readings and compare them against periodic reference cuff checks.
- Use machine learning to detect drift in sensor performance over time.
- Implement OTA firmware updates that adjust calibration parameters based on aggregated data.
- Schedule annual re‑validation studies, especially after hardware revisions.
Proactive monitoring safeguards patient safety and ensures regulatory compliance over the device lifecycle.
8. Internal Reference and Future Trends
For deeper insight into emerging validation frameworks, see the recent Clinical Validation Standards for Wearable Devices white paper that outlines harmonized approaches across regions.
Conclusion
Verifying wearable BP monitor accuracy before clinical use is a rigorous, multi‑step process that blends statistical analysis, sensor engineering, and regulatory compliance. By adhering to ISO 81060‑2:2022, incorporating robust study designs, and maintaining continuous post‑market surveillance, clinicians and manufacturers can deliver reliable, safe blood pressure measurements that enhance patient care while meeting global regulatory expectations.