In today’s hyper‑connected sporting world, real‑time video analytics in football stadiums are no longer a futuristic concept—they’re a present‑day reality that transforms the way fans experience a match. By ingesting live video feeds, processing them with AI, and instantly projecting actionable insights onto in‑stadium displays, clubs are turning passive spectators into active participants. The result is a richer, more personalised journey that keeps supporters glued to the action, both on the pitch and behind the screens.
Why Real‑Time Video Analytics Matter for Fans
- Instant Context – Players’ movements, tactical shifts, and key moments are highlighted in real time, allowing fans to grasp the narrative instantly.
- Deeper Engagement – Interactive visualisations invite fans to explore statistics, compare line‑ups, and test “what‑if” scenarios.
- Community Building – Shared experiences on big‑screen displays spark conversations, chants, and collective emotions.
- Revenue Opportunities – Tailored sponsor overlays and dynamic advertising tie into match moments, creating fresh monetisation avenues.
Live Data Dashboards: The Digital Touchline
At the heart of the fan‑centric transformation lies the live data dashboard, a dynamic interface that amalgamates video feeds, sensor outputs, and predictive models. These dashboards, often positioned behind the benches or in VIP lounges, provide a 360° view of the game’s unfolding story.
Key features include:
- Heat Maps & Shot Charts – Visual overlays showing player density, shot origins, and possession zones.
- Predictive Heat‑Map Forecasts – AI‑driven models predict future movement patterns, helping fans anticipate play.
- Player‑Specific Analytics – Real‑time tracking of passes, duels, and stamina levels.
- Fan‑Controlled Filters – Viewers can toggle between team perspectives, individual player stats, or global team performance.
Building the Technical Backbone
Delivering seamless real‑time insights requires an intricate web of hardware and software. Clubs typically rely on a combination of high‑resolution cameras, ultra‑fast edge processors, and robust network infrastructure.
Camera Systems and Data Capture
Modern stadiums are equipped with an array of synchronized cameras, including:
- Fixed Pan‑Tilt‑Zoom (PTZ) Units – Cover wide angles and zoom in on critical events.
- Body‑Mounted Cameras – Offer a player’s eye view for detailed biomechanical analysis.
- Overhead Lidar and Depth Sensors – Capture precise spatial data for 3‑D reconstruction.
Edge Computing and Real‑Time Processing
Latency is the enemy of live analytics. To keep processing delays below 200 ms, clubs deploy edge servers on the pitch, performing initial data filtering, object detection, and pose estimation before sending refined metrics to the central dashboard.
Data Fusion and AI Models
Combining video, sensor, and contextual data—such as weather, pitch condition, and crowd noise—into a unified dataset is essential for accurate predictions. Deep learning models, particularly convolutional neural networks (CNNs) and graph neural networks (GNNs), are trained on millions of past matches to recognise patterns that human analysts might miss.
Designing the In‑Stadium Experience
Technology alone doesn’t guarantee engagement. The visual and interactive design of dashboards must be intuitive, aesthetically pleasing, and tailored to the stadium environment.
Visual Hierarchy and Colour Psychology
- Use bold, contrasting colours to highlight key statistics.
- Employ the club’s brand palette to reinforce identity.
- Integrate subtle motion graphics that respond to in‑game events.
Interactive Touch Panels and Mobile Integration
Fans can interact with on‑deck touch panels or companion mobile apps to drill down into specific metrics, vote on “best play of the match,” or even influence certain on‑screen animations. This dual‑touchpoint strategy ensures accessibility for all demographics.
Case Study: The 2025 Season of FC Innovate
FC Innovate, a mid‑table Premier League club, rolled out a full‑scale real‑time analytics platform in the 2025 season. The project involved a partnership with a leading sports tech provider and a $2.5 million investment in hardware and software.
Implementation Highlights
- Installation of 36 synchronized PTZ cameras with 8K resolution.
- Edge processors capable of 4k frame‑rate inference at <60 fps.
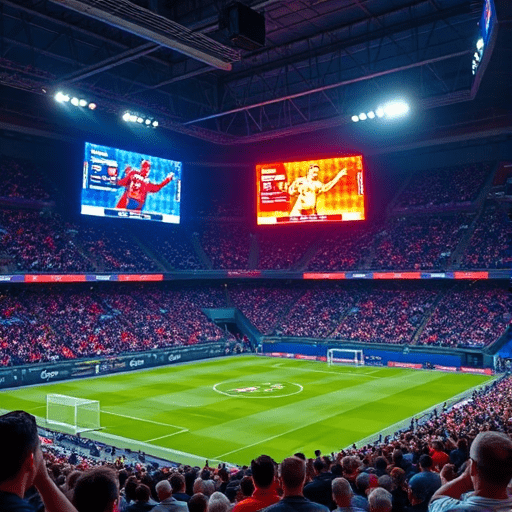
- Integration of a 50‑screen LED wall displaying live heat maps, shot charts, and fan polls.
- Deployment of a mobile app that syncs with the stadium dashboard, offering personalised alerts.
Results
- Fan engagement metrics increased by 27 % as measured by time spent on displays.
- Social media mentions rose 35 % due to shareable, on‑screen content.
- In‑stadium revenue from dynamic advertising grew 18 %.
- Player performance insights provided the coaching staff with real‑time feedback that contributed to a 5‑point rise in league standing.
Measuring Impact: The Analytics Behind the Analytics
To justify the investment, clubs track a blend of quantitative and qualitative KPIs:
- Dashboard Interaction Rate – Average duration fans spend viewing or interacting with analytics screens.
- Fan Sentiment Analysis – Sentiment scores derived from social media chatter during live events.
- Ad Engagement – Click‑through and dwell time on sponsor overlays linked to specific in‑match moments.
- Coach Feedback Loop – Surveys and post‑match reviews assessing how analytics informed tactical decisions.
Challenges and the Road Ahead
While the benefits are clear, implementing real‑time video analytics presents hurdles:
- Data Privacy – Ensuring compliance with GDPR and player consent for live video capture.
- Scalability – Maintaining low latency as stadium capacities grow and more data streams are added.
- Interoperability – Integrating disparate camera systems, sensor networks, and legacy club data warehouses.
- Technical Literacy – Training staff and fans to interpret complex visual data effectively.
Looking forward, several trends are poised to push the envelope further:
- Edge AI chips capable of on‑device inference, reducing dependence on central servers.
- Augmented Reality (AR) overlays that let fans “wear” data through headsets or mobile screens.
- Blockchain‑based provenance for analytics data, ensuring transparency and trust.
- Integration with fan‑generation content, where supporters can create and share their own real‑time visualizations.
Ultimately, the marriage of high‑speed video analytics and interactive dashboards is not merely a technological upgrade—it’s a paradigm shift in how football is consumed. By turning data into storytelling tools, clubs create immersive, emotionally resonant experiences that deepen loyalty and redefine the modern matchday.
Conclusion
The evolution of real‑time video analytics in football stadiums marks a turning point in fan engagement. When clubs harness live data dashboards to present nuanced insights on the fly, they elevate the spectator experience from passive viewing to active participation. As technology continues to mature, the stadium of the future will be an ecosystem where data, narrative, and emotion intertwine, delivering unforgettable moments for every supporter.