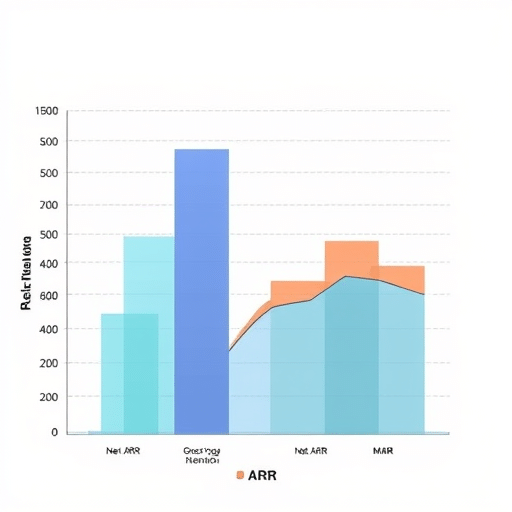
Most B2B SaaS boards obsess over net revenue retention, but a healthy NRR number can quietly camouflage shrinking logos. When a finance leader relies on NRR to declare expansion victory, gross logo churn is doing damage in the background. Decoupling gross retention from net ARR health — and running each through disciplined cohort segmentation — is what separates companies that catch churn early from those that discover the bleed only after it hits renewal forecasts.
Why NRR Alone Is a Distorted Mirror
Net revenue retention blends three motions: logo retention, contraction, and expansion. A large upsell on a single enterprise account can offset dozens of smaller cancellations, leaving NRR flat or growing while the underlying customer base erodes. The metric is useful for investor storytelling, but it is a poor early warning system for revenue durability.
The distortion becomes more pronounced as a company scales. A handful of whale accounts expand aggressively right before renewal, masking an uptick in SMB churn. By the time NRR bends, the cohort damage is often six to nine months old. Finance teams that wait for NRR to move are effectively reading last year’s weather report.
Gross Logo Retention vs. Net ARR Retention: What Each Metric Actually Measures
Gross logo retention answers a single question: of the customers you had at the start of the period, what percentage still exist at the close? It ignores price entirely. Net ARR retention layers price changes on top, weighting the result toward accounts with the largest dollar footprints.
Healthy SaaS businesses maintain gross logo retention above 90% for SMB segments and above 95% for mid-market and enterprise. When those numbers drift below 85% in any segment, even a strong expansion engine eventually runs out of room to compensate. Gross retention is the floor; net retention is the ceiling. A gap that narrows is a leading indicator that expansion is masking decay.
The Mechanics of Masking
- Expansion concentration risk: A single account that doubles its seat count can offset 50 lost SMB logos in NRR math.
- Contraction invisibility: Tier-downgrades often precede logo churn by one to three quarters and are missed when only NRR is reviewed.
- Renewal timing distortion: Annual contracts renew in waves, so cohort decay shows up unevenly across calendar quarters.
Building a Cohort View That Reveals Silent Logo Churn
Cohort segmentation groups customers by the month or quarter they first contracted, then tracks each cohort’s behavior over time. For churn diagnostics, three cuts matter most: acquisition channel, customer segment, and product line. Without those slices, gross retention looks like a single number and hides the cohorts that are bleeding.
Step 1: Define Cohorts With Diagnostic Intent
Skip the temptation to slice by every possible attribute. Start with three to five cuts that map to go-to-market motions: paid acquisition vs. sales-assisted, SMB vs. mid-market vs. enterprise, self-serve vs. onboarding-included, and product SKU. Each cut should correspond to a person on the leadership team who owns the outcome. If no owner exists, the cut is decorative.
Step 2: Track Three Numbers per Cohort
- Logo retention rate: The share of customers from the original cohort still active at month 12, 24, and 36.
- Net dollar retention: The standard NRR figure, calculated per cohort, not blended.
- Contraction rate: The share of original ARR that downgraded before renewal.
The gap between logo retention and net dollar retention is where silent churn lives. When a cohort’s logo retention drops 4 points while net dollar retention holds steady, expansion is propping up the cohort, not real product-market fit.
Step 3: Layer in Leading Indicators
Logo churn rarely arrives without warning. Product usage decline, support ticket sentiment shifts, and a stalled QBR cadence appear 60 to 120 days ahead of cancellation. Embedding these leading indicators into the cohort dashboard turns the view from historical reporting into a forward-looking diagnostic. RevOps teams that automate usage-based risk scoring catch churn before it shows up in any retention metric.
A Practical Diagnostic: The Retention Gap Ratio
One composite metric worth tracking quarterly is the retention gap ratio: the absolute difference between gross logo retention and net dollar retention, expressed in points. A widening gap signals increasing reliance on expansion to offset decay. A narrowing gap is either a sign of genuine customer love or a sign that expansion is also slowing — which the underlying numbers will quickly reveal.
For a typical mid-stage SaaS business, a retention gap above 18 points should trigger a formal cohort review. Anything above 25 points typically means the product team needs to be in the room when the diagnostic is presented. Leadership teams that institutionalize this review convert finance reporting into a strategic conversation rather than a scorekeeping exercise.
How to Operationalize the Decoupling
Decoupling gross retention from net ARR health is not a dashboard project. It is a meeting cadence change. The most effective RevOps teams run a monthly retention diagnostic that follows a fixed script:
- Start with blended gross logo retention; flag any segment more than 2 points below trailing six-month average.
- Drill into the flagged cohort’s net dollar retention; note the gap and any expansion outliers.
- Pull usage and support signals for the top 20 accounts at risk; assign owners for intervention within 14 days.
- Document the cohort story in writing; revisit the cohort 90 days later to confirm the intervention worked or didn’t.
This rhythm forces the conversation away from NRR headlines and toward the structural mechanics driving retention. After two quarters of disciplined execution, gross logo retention typically stabilizes and NRR becomes a genuine reflection of customer value rather than a numerator distortion.
What Healthy Looks Like Across Stages
Stage-appropriate benchmarks matter because retention profiles shift with scale. A PLG-led SaaS company growing through self-serve should expect gross logo retention in the high 80s, with NRR above 100 thanks to in-product upgrade paths. An enterprise-led SaaS company should run gross logo retention above 95 and NRR above 110, with contraction rates well below 5%. When a company outperforms its stage on NRR but underperforms on gross retention, leadership should treat it as a structural warning, not a celebration.
The Strategic Payoff of Honest Retention Math
Boards and CFOs who push past NRR headlines gain a quieter but more valuable advantage: the ability to intervene before retention decay compounds. Expansion engines are expensive to build and easy to lose. The customers who stay, pay their full price, and quietly grow into larger contracts are the foundation of durable ARR. Decoupling gross retention from net ARR health — and backing both with disciplined cohort segmentation — is the discipline that protects that foundation from silent erosion.
The companies that internalize this practice stop treating retention as a single number and start treating it as a system. Logo churn becomes visible the moment it appears, expansion gets measured against the cohort that earned it, and leadership conversations shift from quarterly surprises to monthly diagnostics. That is what healthy revenue actually looks like underneath the NRR lens.