When a SaaS board asks about Net Revenue Retention (NRR), the answer is usually a clean percentage north of 110%, framed as proof of product-market fit. Yet beneath that reassuring number, a quieter phenomenon can be eroding the foundation: expansion revenue decay hiding inside cohorts that still look healthy on paper. Understanding why NRR can mask silent churn within seemingly healthy cohorts is becoming one of the most important analytical disciplines for SaaS operators heading into the next planning cycle.
What NRR Actually Measures — and What It Doesn’t
Net Revenue Retention compresses four movements into one figure: gross retention from existing customers, price downsells, churn, and upsell or cross-sell expansion. When expansion is strong, the aggregate masks erosion. A cohort losing 4% of its base monthly while expanding 7% from usage-based workloads can still post an NRR of 103% — a number that calms the room.
The problem is compounded by how NRR cohorts are typically constructed. Most teams group customers by signup quarter, then watch how that cohort behaves over time. What gets lost is the differential inside the cohort: power users expanding aggressively while mid-tier accounts quietly downgrading seats.
The Mechanics of Expansion Revenue Decay
Expansion revenue decay describes a pattern where expansion dollars earned from a cohort today are smaller than expansion dollars earned from the same cohort twelve months prior, despite identical or growing logo counts. Three forces typically drive it:
- Seat compression: customers keep their contracts but quietly deactivate users as departments restructure.
- Usage throttling: API consumption or seat-time plateaus as workflows mature, removing the automatic expansion that early-stage adoption delivered.
- Price-pack friction: customers resist upgrades to higher SKUs, keeping revenue pinned to legacy tiers while list prices climb.
Each of these looks like neutral behavior in isolation. Stacked together, they create an NRR that looks stable while expansion velocity is quietly bleeding out.
Why Healthy NRR Cohorts Still Harbor Silent Churn
Silent churn is the disappearance of revenue without the disappearance of the customer logo. It is the consequence of contractions, tier migrations, and feature pruning that never trigger a cancellation event. When expansion is robust, silent churn becomes nearly invisible because the absolute retention number remains positive.
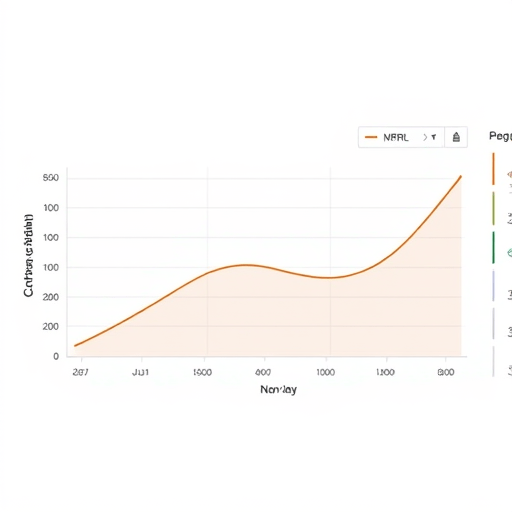
A useful diagnostic is the “expansion ratio”: expansion dollars divided by starting ARR for each cohort, measured on a rolling four-quarter basis. A cohort that expanded at 14% in year one and 6% in year three is decaying even if total NRR still reads 108%. Most finance teams never isolate this because the cohort math gets averaged into the company-wide figure.
A Forensic Framework for Diagnosing the Leak
Moving from a comfortable NRR percentage to actionable diagnosis requires a five-layer forensic approach. Each layer reveals a different dimension of the hidden leak.
Layer 1: Segment the Cohort by Behavioral Tier
Split each quarterly cohort into three behavioral tiers based on twelve-month product usage data: high-engagement, mid-engagement, and dormant. Plot NRR for each tier separately. In a leaky cohort, mid-engagement accounts are usually the source of silent churn, while high-engagement accounts do most of the expansion heavy lifting. The aggregate hides this asymmetry.
Layer 2: Decompose Gross Retention From Expansion
Compute a “gross NRR” that excludes expansion revenue and an “expansion NRR” that excludes contractions. When gross NRR slips from 96% to 92% while expansion NRR holds steady, the cohort is rotating toward a retention problem. When expansion NRR slips from 115% to 108% with stable gross NRR, the cohort is experiencing pure decay. The two failure modes require different remediations.
Layer 3: Track Cohort Aging and Survival Curves
Create a survival curve for each cohort that shows percentage of original ARR still active at month 24, 36, and 48. Compare cohorts born in different quarters. Aging effects — natural decay of early adopters — should be roughly linear; deviations suggest either product drift or competitive displacement. The survival curve exposes cohorts that look fine in their first year but fade soon after.
Layer 4: Inspect Expansion Concentration
Calculate the share of total cohort expansion contributed by the top decile of customers. If more than 60% of expansion comes from fewer than ten accounts, the cohort’s NRR is structurally fragile. The loss of one or two expansion super-users can crater the cohort number without affecting gross retention at all.
Layer 5: Reconcile Billing Telemetry With CRM Records
The final layer is operational: compare invoiced amounts against contracted values for every account in the cohort. Discrepancies reveal quiet downgrades, mid-cycle credits, and end-of-term auto-renewals that did not honor previously negotiated pricing. This reconciliation often surfaces five to ten points of unexpected contraction per cohort.
Signals That Expansion Decay Has Started
Before the NRR number breaks, several leading indicators usually flicker. Watch for these as early warning signs:
- Net seat additions flat or negative while net account count grows.
- Average revenue per active user declining inside otherwise stable cohorts.
- Upgrade win rates holding while average upgrade size shrinks.
- Quote-to-close times lengthening for expansion deals.
- Customer success quarterly business reviews adding more downgrade discussions than upsell conversations.
None of these individual signals screams problem, but together they form a pattern that precedes the NRR breakdown by two to four quarters.
Remediation Tactics Once the Leak Is Confirmed
Once a cohort exhibits expansion decay, the response should match the diagnosis. Seat compression calls for value-realization programs targeted at dormant user populations. Usage throttling benefits from workload expansion plays — new integrations that re-ignite consumption. Price-pack friction responds to in-product prompts that surface previously hidden premium capabilities.
For cohorts where expansion is concentrated in a few accounts, the priority is diversification: build expansion motions that scale across mid-tier customers rather than relying on whale behavior. This usually involves packaging lighter-tier upgrades with success milestones rather than waiting for procurement-driven annual negotiations.
Embedding the Framework into Operating Cadence
Treating expansion decay as a recurring diagnostic — not a one-time investigation — is what separates durable SaaS businesses from those that mistake a strong NRR for durable health. A practical cadence runs the five-layer forensic framework once per quarter, comparing results across the four most recent cohorts. The output is a cohort-by-cohort decay score that informs planning conversations, capital allocation, and pricing decisions for the year ahead.
The board will continue to ask about NRR. The leaders who understand what lives beneath it will be the ones best positioned to act before the leak turns into a flood.
The framework above gives finance and revenue teams a shared vocabulary for diagnosing silent churn that hides inside healthy-looking NRR cohorts, turning a headline metric into a detailed map of where expansion dollars are quietly evaporating and what to do about it.