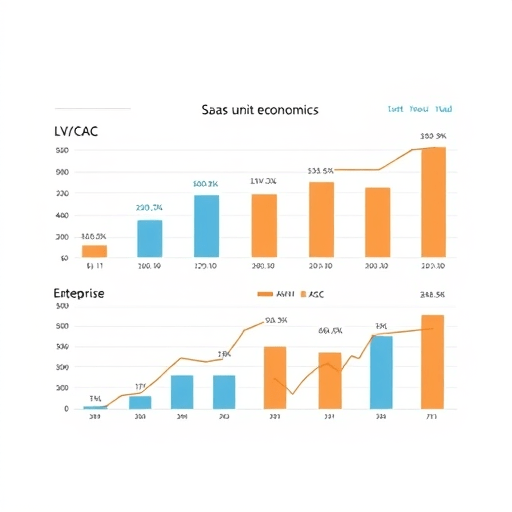
Most SaaS finance teams obsess over blended LTV-to-CAC ratios, but the real story hides inside customer segmentation. A scenario-based unit economics calculator lets you isolate the contracts, industries, and product lines that quietly drag down profitability, then stress-test recovery paths before you spend another dollar on acquisition. This guide walks through building that model from scratch, with a sharp focus on identifying which segment is silently destroying your margins.
Why Blended Unit Economics Lie to You
Blended metrics are useful for board updates and investor pitches. They are dangerous for operating decisions. A blended CAC of $1,200 and a blended LTV of $4,800 sounds healthy at a 4:1 ratio, but that number can mask a self-serve segment returning 9:1 while an enterprise motion bleeds at 1.2:1.
When you pool customers into a single average, you lose the signal that matters: which acquisition channel, customer profile, or product package is structurally unprofitable. Building a calculator that segments by customer type, sales motion, or industry exposes these patterns and turns gut-feel pricing debates into data-driven conversations.
The Core Metrics Your Calculator Must Track
Before touching a spreadsheet, lock down the four inputs that drive every SaaS unit economics model:
- Annual Recurring Revenue (ARR): the annualized value of all active subscriptions, including upgrades, cross-sells, and contraction. Track it per segment, not just at the company level.
- Churn rate: both logo churn and dollar churn. Logo churn reveals retention gaps; dollar churn reveals whether your remaining base is expanding or shrinking.
- Customer Lifetime Value (LTV): the gross-margin-adjusted revenue you capture over a customer’s lifetime. Most teams underestimate LTV by ignoring gross margin, which inflates apparent returns.
- Customer Acquisition Cost (CAC): the fully-loaded sales and marketing spend required to close one customer, including salaries, tools, and overhead allocated properly.
Add two derived outputs that make the model actionable: the LTV/CAC ratio and CAC payback period in months. These are the lenses investors use, and the lenses operators should use too.
Designing a Scenario-Based Model Structure
A scenario-based calculator differs from a static dashboard because it lets you flip assumptions and watch the math move in real time. Structure the workbook around three layers:
1. Input Layer
Segment the inputs across rows. Common axes include SMB, mid-market, and enterprise; product line; geography; or sales motion (inbound self-serve, outbound, partner-led). For each segment, capture:
- Average contract value (ACV)
- Monthly logo churn rate
- Net revenue retention (expansion minus churn)
- Fully-loaded CAC, broken into marketing, sales, and onboarding components
- Gross margin per customer
2. Calculation Layer
From the inputs, derive per-segment LTV using a simple formula: LTV = (ARPA × Gross Margin %) ÷ Monthly Churn Rate, where ARPA is average revenue per account. Multiply by 12 for an annualized view. Divide LTV by CAC for the ratio, then divide CAC by (ARPA × Gross Margin %) for payback months.
3. Scenario Layer
This is where the model becomes strategic. Build toggles for price increases, churn reduction, CAC efficiency, and expansion rate. Most importantly, allow the user to model a “what-if” where a particular segment is exited entirely, so the team can quantify the cost of staying versus the cost of pruning.
Spotting the Segment Quietly Destroying Profitability
Once the calculator is wired, run a diagnostic across each segment using these three filters:
- Negative contribution margin after CAC: the customer generates more cost than revenue over a 24-month window.
- Payback period exceeding 18 months: capital is tied up too long, and downturn risk compounds.
- Churn above 3% monthly for SMB or 1% monthly for enterprise: structural churn that no optimization will fix without a product change.
In my experience reviewing SaaS P&Ls, the culprit is rarely the smallest segment. It is usually the segment that grew fastest under a former VP’s tenure, has the loudest internal champion, and benefits from a sales commission structure that masks its true cost. The calculator forces honesty because the numbers do not care about organizational politics.
Three Scenarios Worth Modeling First
Scenario A: The Price Increase Test
Raise ACV by 10% across each segment and watch LTV shift. If the segment with the worst LTV/CAC ratio still fails to clear 3:1, price is not the problem. Acquisition cost or churn is.
Scenario B: The Retention Investment Test
Model a 1-point reduction in monthly churn for each segment by investing in customer success. Compare the resulting LTV against the cost of the additional hires. This often reveals that mid-market is where retention dollars compound fastest.
Scenario C: The Channel Diversification Test
Swap the CAC assumption from your dominant outbound channel to a partner-led motion. If CAC drops by 40% but sales cycle lengthens, the payback period may worsen despite the lower acquisition cost. The model shows you this instantly.
Common Modeling Mistakes to Avoid
Three errors show up in nearly every flawed SaaS unit economics model:
- Using revenue instead of gross margin in LTV: hosting, support, and implementation costs are real and must be subtracted before judging customer value.
- Ignoring expansion revenue in churn calculations: a segment with 5% gross churn and 15% expansion is healthier than it appears; a segment with 2% churn and no expansion is quietly stagnant.
- Allocating CAC by deal count instead of deal value: enterprise deals cost more per transaction, and spreading that cost evenly across all customers distorts the SMB picture.
Turning the Calculator into a Decision-Making Tool
A calculator is only valuable if it changes behavior. Tie it to quarterly planning by requiring every segment to clear a defined threshold (for example, 3:1 LTV/CAC and 12-month payback) before receiving new acquisition budget. Segments that fail the threshold should be flagged for one of three actions: restructure pricing, redesign the go-to-market motion, or exit entirely.
The discipline of running scenarios quarterly also prepares the team for the inevitable board question: “What happens to your economics if churn doubles?” A scenario-based calculator lets you answer that in under a minute with a defensible number, rather than scrambling through spreadsheets.
Conclusion
A well-designed SaaS unit economics calculator does more than produce investor-friendly ratios. It functions as a diagnostic instrument that separates the segments quietly building wealth from the ones quietly burning it. By segmenting inputs, layering scenarios, and tying outputs to capital allocation decisions, finance and revenue leaders can finally have the honest conversation about which customers deserve more investment and which deserve a graceful exit. The next step is building the model in your preferred spreadsheet or BI tool and running the three scenarios above against your current book of business. The segment that surprises you most is the one worth investigating first.